Market Snapshot
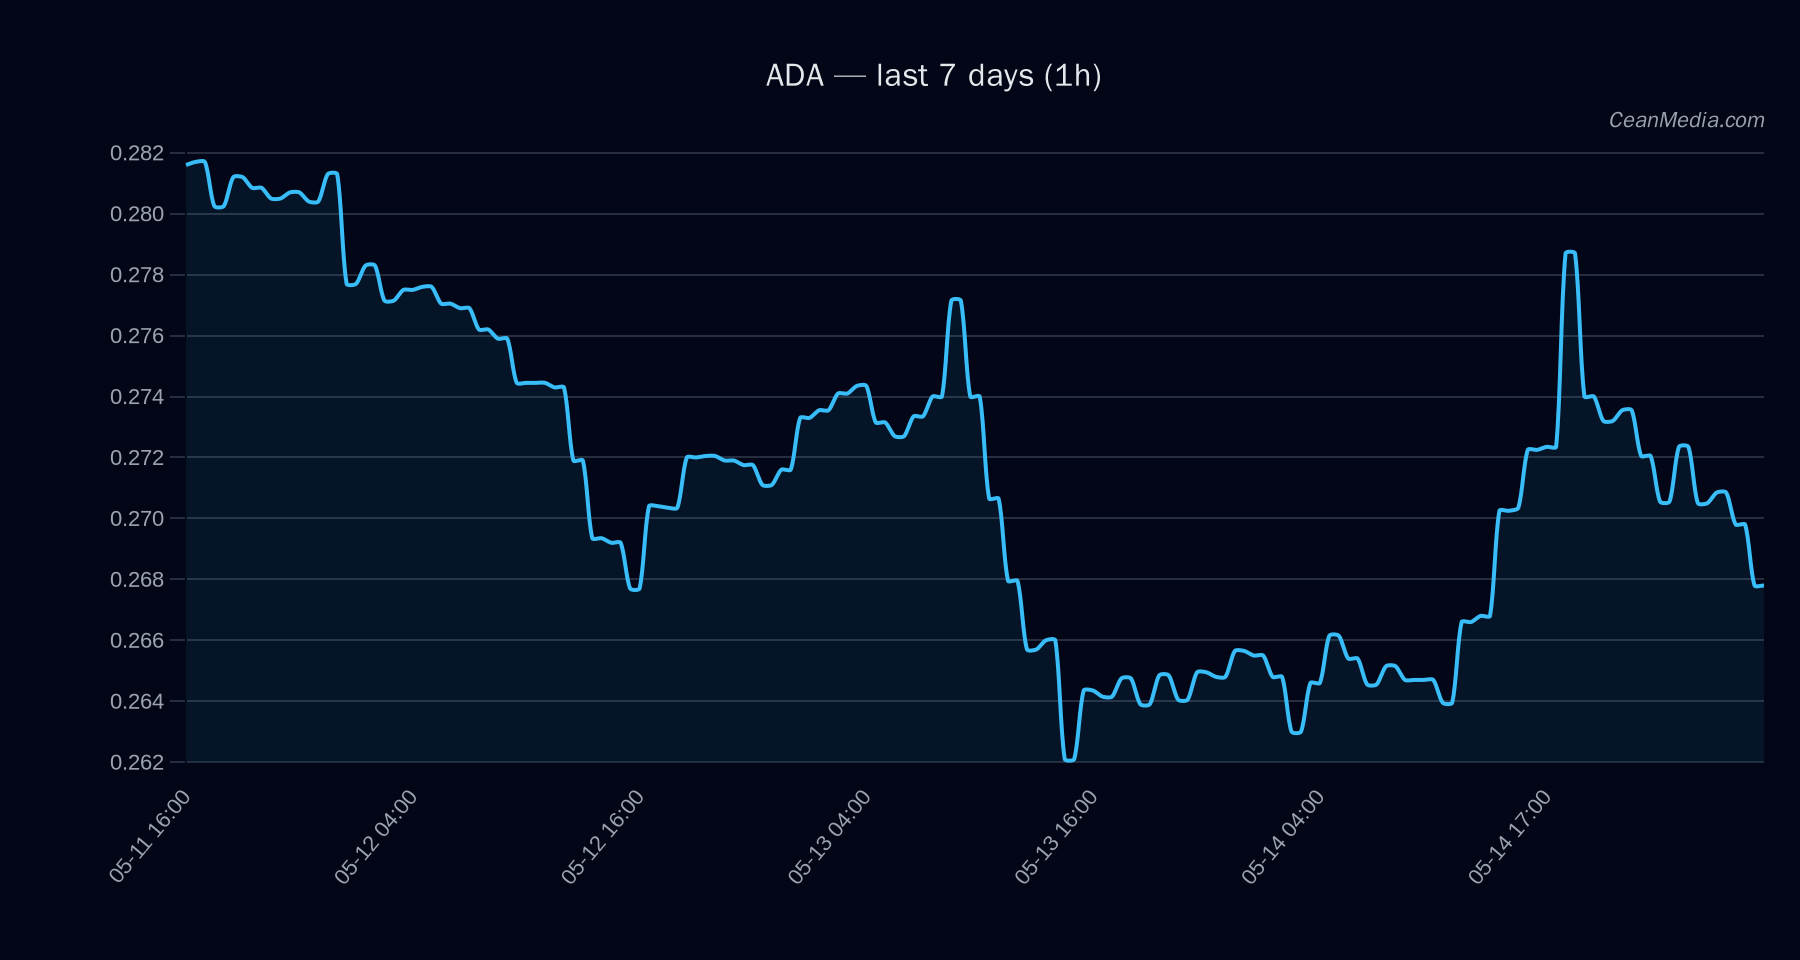
On 2026-05-15, ADA traded around the 0.266 level with a close of 0.2661. Market context shows very low volatility and a mixed to bearish bias with a low confidence level. BTC correlation remains elevated around 0.71 over 72 hours, and breadth sits around 50% above its 50-day moving average, suggesting a cautious risk environment.
Technical Analysis: ADA
: -3.9 with one conflict. : Sits between support near 0.26 and resistance near 0.27. Break above 0.27 targets 0.2769–0.2823; break below 0.26 targets 0.2556–0.2503. : Support near 0.26; major support near 0.245. Resistance near 0.27; major resistance near 0.275. - Up: 1h close above 0.27 implies potential move to 0.2769–0.2823.
- Down: 1h close below 0.26 implies potential move to 0.2556–0.2503.
Drivers
- Top model drivers indicate negative momentum from EMA slope and price spread, with a negative Basis Z-score (-1.45) and modest positive 24h return (0.01).
- Funding Z-score shows a non-trivial positive signal (0.61), while Order-Book Imbalance (EMA5) remains slightly negative (-0.02).
- BTC-related dynamics contribute modestly to ADA’s direction (BTC 24h return ~0.016, BTC vol regime strong at 1).
- Market breadth sits near 50% above SMA50, indicating mixed participation; Fear gauge (F&G) at 43, suggesting cautious sentiment.
ETF Flows (BTC/ETH)
The ETF flows data provided covers BTC and ETH only and should be interpreted as context rather than a primary signal for ADA. Recent readings show strong ETF inflows in BTC (1D +$629.8M; 5D +$198.4M; 10D +$585.2M) and solid inflows for ETH in the 1D period (+$101.2M) with mixed 5D flows. This pattern suggests a risk-on backdrop for BTC/ETH, which can influence correlated assets, though ADA-specific momentum may diverge due to idiosyncratic factors.
What to Watch Next
- Watch for a decisive close above 0.27 to validate a potential move toward 0.2769–0.2823.
- Monitor a break below 0.26 with high volume for confirmation of downside targets around 0.2556–0.2503.
- Track changes in BTC/ETH ETF flows for shifts in risk sentiment and their potential spillover into ADA liquidity and flow dynamics.
- Keep an eye on volatility regime and breadth indicators as they can alter the probability of breakouts in a low-vol environment.
Hashtags: #ADA #CryptoAnalysis #MarketSnapshot #TechnicalAnalysis #ETFFlows #BTC #ETH #Altcoins #CryptoMarkets #RiskOn #PriceAction #Liquidity