
Market Snapshot
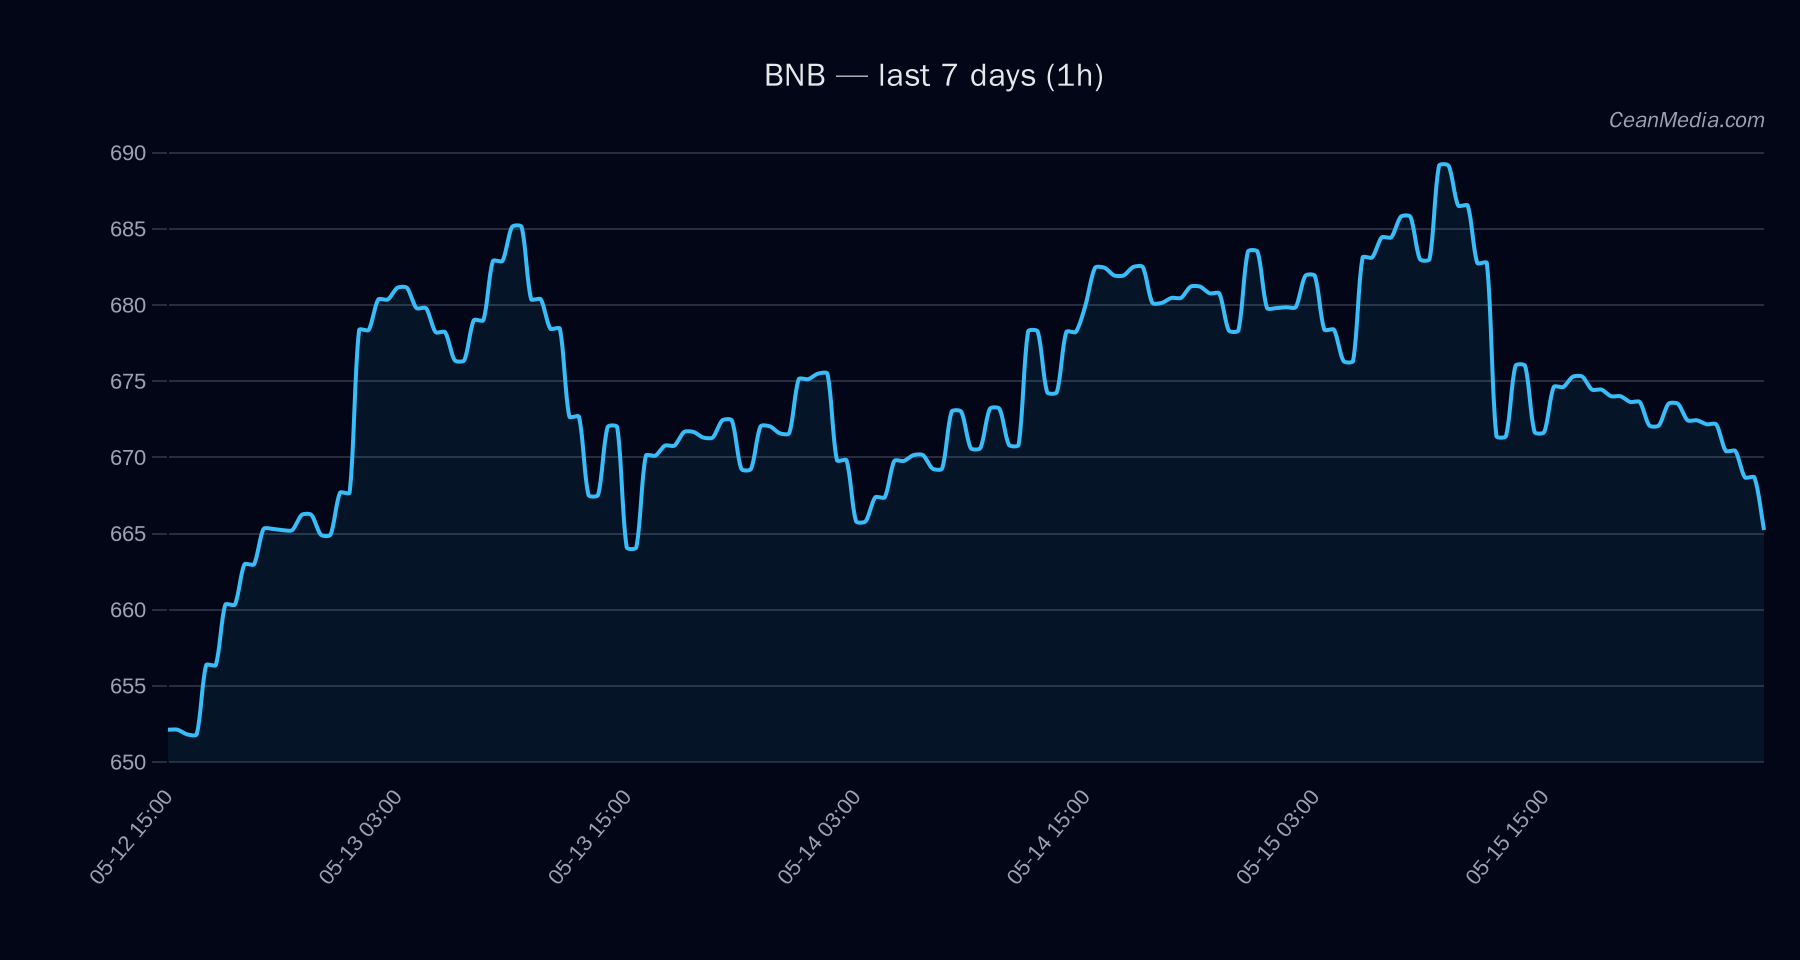
On 2026-05-16, BNB trades in a mixed to bearish pressure environment with a low certainty forecast. The latest close sits at 662.92, with a forecast model leaning toward upside but accompanied by notable downside risk and low volatility. Cross-market context shows risk assets softening, stablecoin liquidity contracting, and a fear/uncertainty reading elevated relative to peers.
Technical Analysis: BNB
- mixed / bearish pressure; certainty low (5/100).
- -2.5; data completeness 97%.
- Close at 662.92. Within a price range bounded by support near 650 and resistance near 676, with a major resistance around 674.
- sideways. RSI at 32 suggesting oversold conditions but momentum remains muted. EMA12 < EMA26 and SMA50 > SMA200 indicate a range-bound environment. Volatility regime described as very low (σ24h ~0.56%).
- 659.70 – 691.44. P50 sits at 661.30.
-
- Up: 1h close > 676 → potential move toward 689.70 – 703.23
- Down: 1h close < 650 → potential move toward 636.67 – 623.68
- Support near 650; Major support 631. Resistance near 676; Major resistance 674.
- Very low volume regime; breadth at or near 0% above SMA50; BTC correlation (72h) ~0.78; fear index around 25 (extreme fear).
Drivers
-
- SPREAD_BP: negative contribution; -5.08
- LS TOP DELTA 24H: positive contribution; value 3.31
- LS GLOBAL DELTA 24H: positive contribution; value 3.17
- FNG VALUE: positive contribution; value 24.8
- BASIS Z-SCORE: negative contribution; value -6.74
- GOLD RETURN 5D: small negative contribution; -0.36
- Cross-market risk assets weaker; stablecoin liquidity contracting; fear index elevated (F&G: 31); BTC.D around 58.3% with a slight up move; ETF flows indicate net positive interest in BTC/ETH ETFs over 1D and longer horizons.
- Taker flow is balanced; positioning shows long crowding (1.49x).
ETF Flows (BTC/ETH)
Contextual note: ETF data provided pertains to BTC and ETH only and should be treated as market context rather than a primary signal for BNB. The latest equipment indicates sustained positive ETF inflows for BTC and ETH, which can reflect broader risk-on demand in crypto markets and can influence cross-asset dynamics.
- 1D +$629.8M; 5D +$198.4M; 10D +$585.2M
- 1D +$101.2M; 5D -$20.8M; 10D +$81.6M
What to Watch Next
- Break above 676 would open potential path toward 689.70–703.23 in the short term.
- Break below 650 would target 636.67–623.68, increasing downside risk.
- Monitor changes in BTC/ETH ETF inflows, as sustained inflows may signal broader risk-on positioning impacting altcoins like BNB.
- Watch for shifts in overall market breadth and volatility regime, given current very low volatility and mixed TA signals.
Hashtags: #BNBAnalysis #CryptoMarket #TechnicalAnalysis #ETFFlows #BTC #ETH #MarketSnapshot #Altcoins #RiskOn #Volatility