Market Snapshot
As of 2026-05-16,SOL is trading with a bearish tilt in a very low-volatility environment. The price sits around $89.41 with a forecast range implying potential movement toward the mid-to-upper 80s and high-90s on favorable triggers. MACRO signals show risk assets softening and BTC dominance at elevated levels, providing a broader context for altcoins during this period.
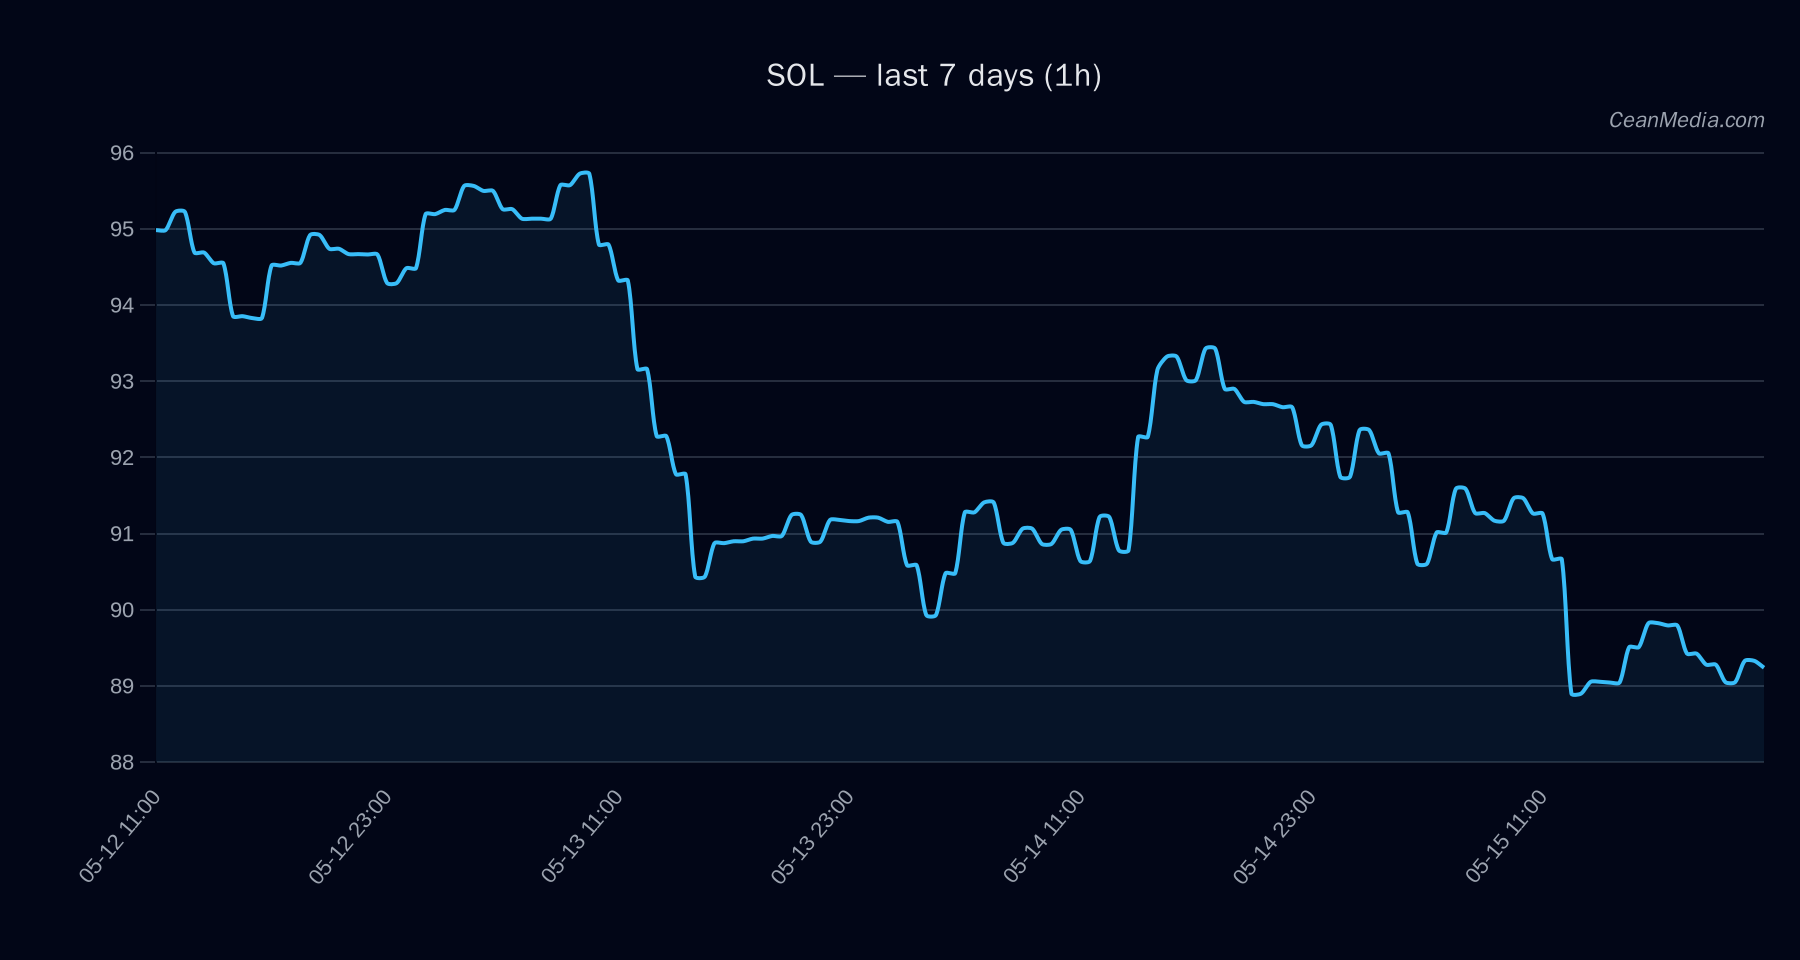
Technical Analysis: SOL
- Bearish bias with high certainty (86/100). Forecast indicates a modest upside probability (50%), but technical trend remains bearish.
-
- Close: 89.41
- Support near: 87.6 (major 84.1 below)
- Resistance near: 91.2 (major 94.7 above)
- Forecast range (P50): 89.72; P20–P80: 82.48–98.23
-
- Upward break > 91.2 closes to target 93.02–94.85
- Downward break < 87.6 closes to target 85.87–84.12
- EMA12 < EMA26, SMA50 < SMA200, RSI 39; volatility regime: very low; RSI described as neutral.
- Price is within a defined range; no breakout confirmation yet. Market breadth is flat, with BTC correlation high at 0.88.
Drivers
- BTC dominance, LS Global Z-Score, and stable market capitalization metrics contribute notable signals for risk-on/off context.
- Very low vol regime. Sigma 24h at 0.58% aligns with a muted trading environment. Trend strength indicators point to a cautious stance rather than a definitive directional move.
- Taker flow implies selling pressure, while positioning shows long crowding (1.60x). Macro signals indicate cross-market softness in risk assets and contracting stablecoin liquidity over 7 days. Fear index around 34 suggests cautious or defensive sentiment.
ETF Flows (BTC/ETH)
Note: ETF flow data presented here is limited to BTC and ETH. This section provides context for broader market liquidity and risk appetite but is not a primary signal for SOL decisions. BTC ETF flows show broad-based inflows (1D: +$629.8M; 5D: +$198.4M; 10D: +$585.2M); ETH ETF flows also show inflows in the short term (1D: +$101.2M; 5D: -$20.8M; 10D: +$81.6M).
The observed BTC/ETH inflows point to a risk-on undertone in parts of the crypto market, which can support liquidity and risk appetite for correlated assets. However, SOL remains primarily affected by asset-specific technicals and alt-asset dynamics in a low-vol environment.
What to Watch Next
- Monitor price action around 91.2 resistance for a potential breakout trigger.
- Watch for a close above 91.2 to validate an upside path toward 93.02–94.85.
- If price breaks below 87.6, reassess risk with targets around 85.87–84.12.
- Keep an eye on BTC dominance and risk-asset breadth as supplementary context for SOL moves.
Hashtags: #SOL #CryptoAnalysis #MarketSnapshot #TechnicalAnalysis #ETFFlows #BTC #ETH #RiskOn #Altcoins #Volatility #TradingStrategy #CryptoMarkets