Market Snapshot
Date: 2026-05-16 to 2026-05-17
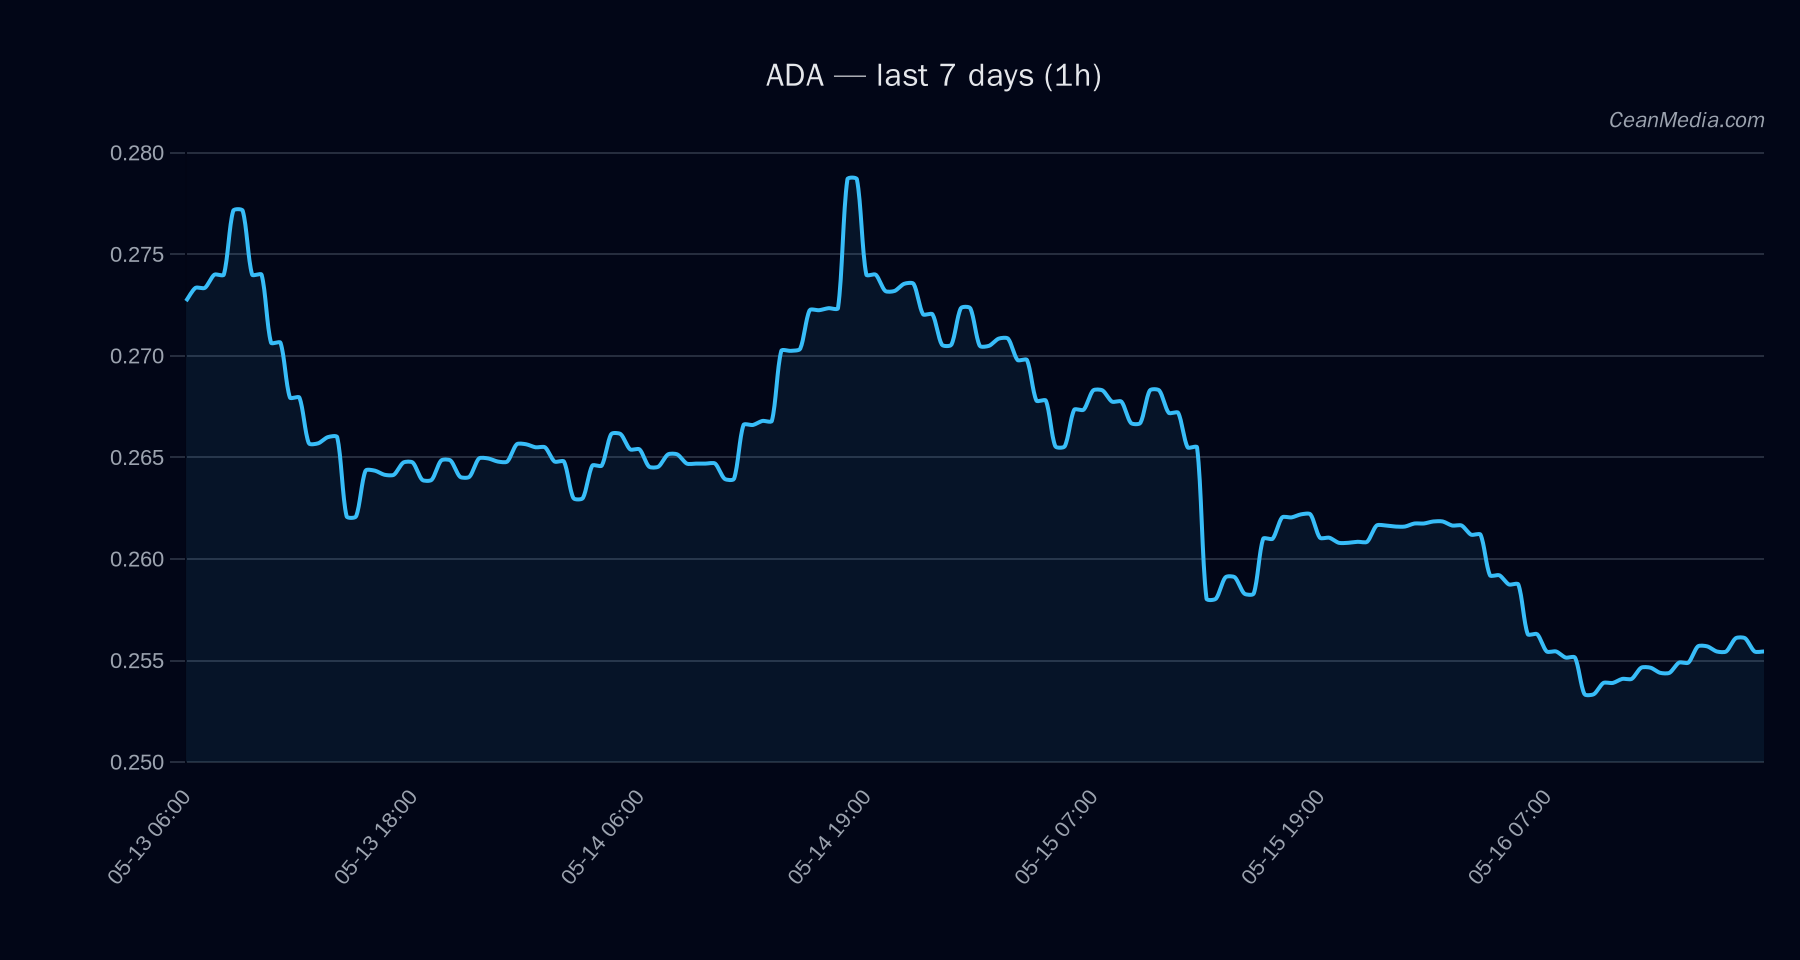
Primary asset: ADA. Latest close: 0.2553. Market conditions show very low volatility with muted breadth signals. BTC/ETH ETF flow data indicate a constructive demand backdrop for risk assets in the crypto space, though its direct relevance to ADA remains contextual rather than primary.
Technical Analysis: ADA
-6.0 ADA sits between support near 0.25 and resistance near 0.26. - Support: 0.25 (major), near 0.25
- Resistance: 0.26 (major 0.275)
P50 0.2581; P20-P80 0.2460–0.2714 Down (51%); Up 42%; Side 6% Bearish. RSI 37. Indicators: EMA12 - Up: 1h close > 0.26 targets 0.2656–0.2708
- Down: 1h close < 0.25 targets 0.2452–0.2402
Drivers
- Return 24h: -0.03
- EMA slope: -0.00028
- Funding Z-score: -1.45
- Basis Z-score: 1.21
- OBI (EMA5) imbalance: +0.012
- BTC return 24h: -0.013
Cross-market risk assets soft; Fear/Greed index around Fear. BTC dominance ~58.3% with modest positive delta over 7 days. Vol regime very low; ATR ~0.0007; price movements constrained within narrow bands.
ETF Flows (BTC/ETH)
Context note: ETF flow data shown here reflect BTC and ETH ETFs only. This information provides a sense of broader risk appetite and participation in the crypto ecosystem but is not a direct signal for ADA. The data suggest a constructive demand backdrop for risk assets in the BTC/ETH space (1D positive flows), which can support sentiment for crypto assets generally, though ADA-specific drivers remain central here.
- BTC ETF: +$629.8M (1D), +$198.4M (5D), +$585.2M (10D)
- ETH ETF: +$101.2M (1D), -$20.8M (5D), +$81.6M (10D)
What to Watch Next
- Watch for a close above 0.26 to validate a short-term bullish trigger toward 0.2656–0.2708.
- If ADA breaks below 0.25, monitor for a move toward 0.2452–0.2402.
- Monitor BTC/ETH ETF flow strength as a contextual gauge of risk sentiment, not a primary ADA signal.
- Assess any change in volatility regime or breadth signals that could alter the current bearish bias.
Hashtags: #ADA #CryptoAnalysis #MarketSnapshot #TechnicalAnalysis #ETFFlows #BTC #ETH #RiskOn #CryptoMarkets #PriceAction #TradingStrategy