Market Snapshot
SOL price sits near the 84.3–87.7 trading range, with a bearish tilt in the short term. The model assigns a 47% probability to continued upside movement over the next 24 hours, while other signals indicate selling pressure persists. Market breadth is weak, and the BTC dominance backdrop shows modest strength, providing a nuanced environment for ALT coins like SOL.
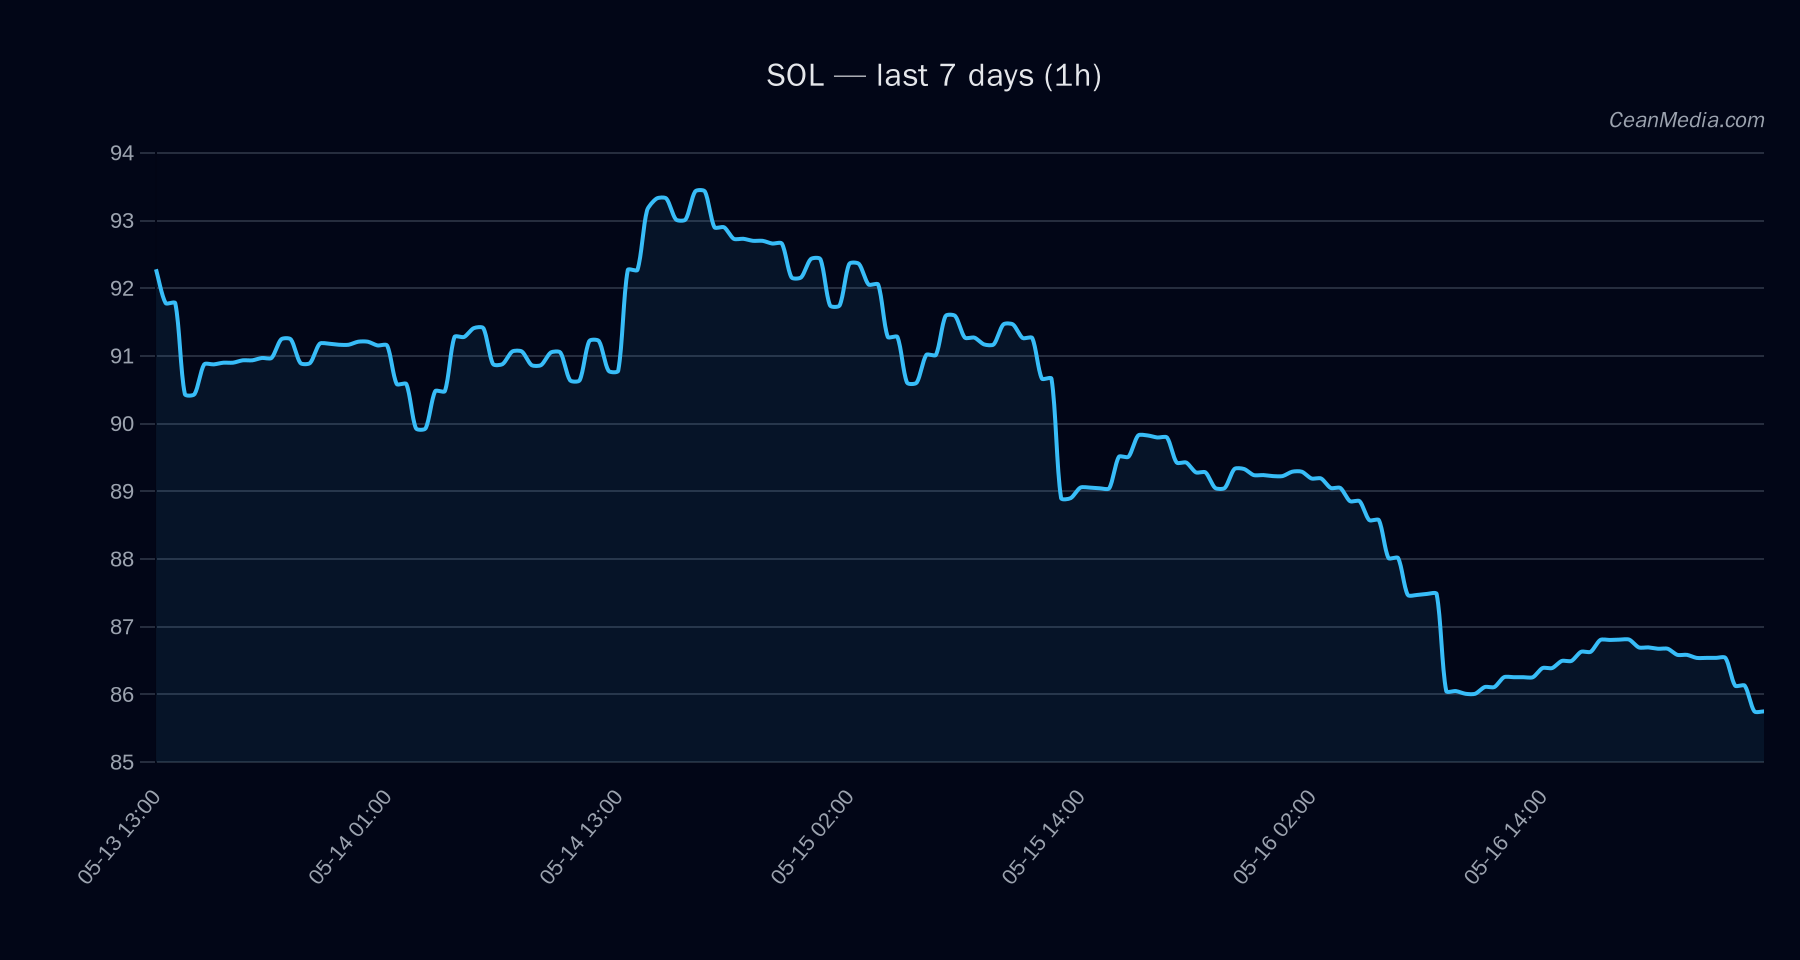
Technical Analysis: SOL
EMA12 < EMA26, SMA50 < SMA200, RSI 24, volatility regime: Very low, 24h σ = 0.38% 84.81; P20-P80: 79.16 – 86.79
Contextual read indicates SOL is trading within a defined range with a bearish TA bias and an oversold RSI, suggesting any breakout confirmation will be key for directional validation.
Drivers
- Top model drivers emphasize cross-market risk sentiment and BTC-dominance dynamics, with negative contributions from 24h BTC returns and related volatility signals.
- Notable momentum factors include EMA slope and distance from MA, which currently support a cautious stance for near-term upside.
- Volatility regime remains very low, reducing average intraday ranges and amplifying the importance of trigger levels.
ETF Flows (BTC/ETH)
BTC/ETH ETF flow context is provided as market backdrop and is not a primary signal for SOL. Recent data shows BTC ETFs delivering solid inflows (1D +$629.8M; 5D +$198.4M; 10D +$585.2M) and ETH ETFs also posting inflows (1D +$101.2M; 5D -$20.8M; 10D +$81.6M). These flows imply a risk-on tone in the broader crypto market on short horizons, but SOL-specific movements should be interpreted within its own TA/price action framework.
What to Watch Next
- Break above 87.7 would open the path toward 89.46–91.22; confirmational strength via 1h closes above resistance.
- Break below 84.3 would target 82.58–80.90; watch for quick validation with sustained closes below the support level.
- Monitor RSI for any turn above mid-range to indicate relief from oversold conditions and potential trend bias shift.
- Keep an eye on BTC dominance and overall market breadth as corroborating signals for altcoin risk, though SOL decisions should remain grounded in its own levels and triggers.
Hashtags: #SOL #crypto #trading #technicalanalysis #ETFflows #BTC #ETH #marketanalysis #riskon #altcoins #priceaction
Note: ETF data shown here is BTC/ETH focused and used for contextual market temperature, not as a primary SOL signal.