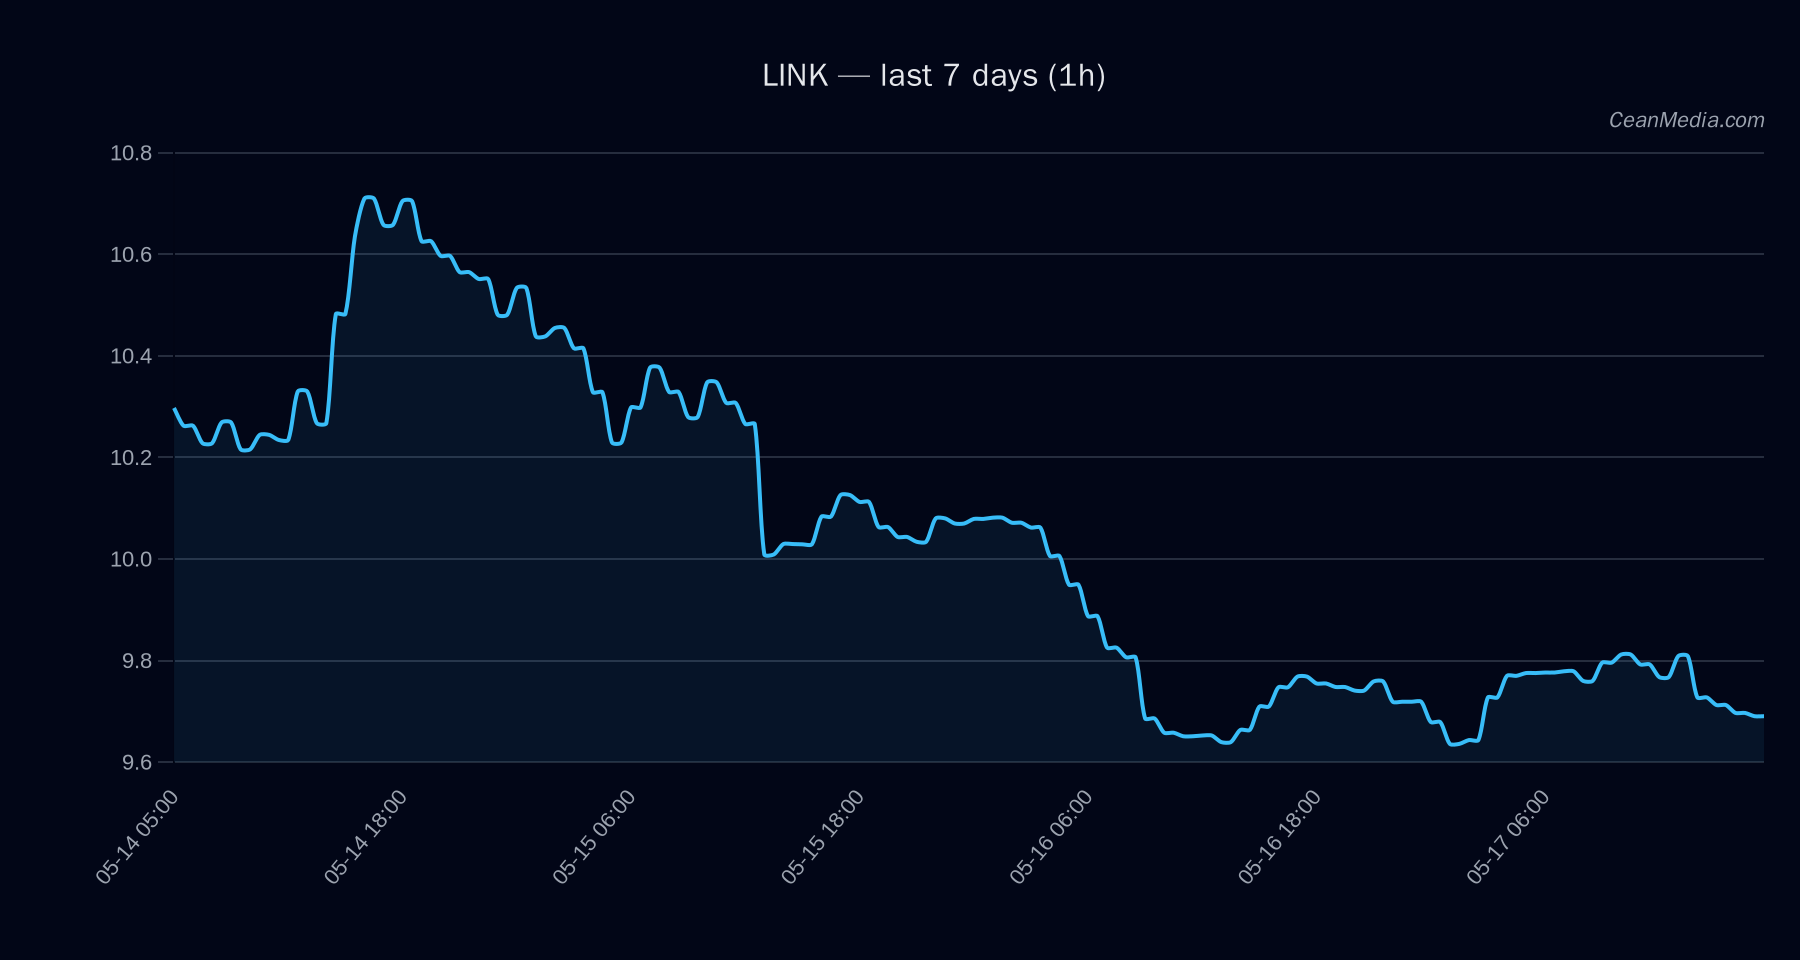
Market Snapshot
As of May 17, 2026, LINK is trading near the mid-9s band with a close of 9.72. The composite view is mixed to bearish with low certainty (44/100). The broader context shows very low volatility and a risk-off backdrop in multi-asset markets, lightly supported by crowded long positioning but constrained by weak breadth.
Technical Analysis: LINK
Down (52%); Up 37%; Side 11%. Bearish. Indicators include EMA12 < EMA26, SMA50 < SMA200, RSI 43, volatility (σ24h) 0.34%, very low vol regime. - Support near 9.52; major support 9.14
- Resistance near 9.92; major resistance 10.6
9.9176; 20th–80th percentile: 9.0923 – 10.3966 - Up: 1h close > 9.92 → potential move toward 10.1127–10.311
- Down: 1h close < 9.52 → potential move toward 9.3351–9.1446
Drivers
- SPREAD BP: -3.3 (contrib +3.96)
- FNG Delta 7D: -16 (contrib -2.94)
- FNG VALUE: +21.6 (contrib -2)
- BTC Dominance: +2.13 (contrib -0.96)
- BTC RV 24H: -0.71 (contrib +0.78)
Cross-market risk assets softer; Fear sentiment around 27; BTC.D around 58.3% with a mild positive delta. Very low vol regime; breadth near 0%, indicating limited participation outside key names.
ETF Flows (BTC/ETH)
ETF flow data is provided for BTC and ETH and is included here as a contextual backdrop. It is not considered a primary signal for LINK, but it helps frame the broader risk environment. Recent data show BTC ETFs with net inflows (1D +$629.8M, 5D +$198.4M, 10D +$585.2M) and ETH ETFs with positive 1D flow (+$101.2M) but mixed medium-term totals. The net effect suggests a marginally supportive risk-on backdrop in aggregate crypto assets, though LINK-specific action remains driven by its own technicals and microstructure.
What to Watch Next
- Monitor a close above 9.92 for potential upside extension toward 10.11–10.31.
- Watch for a break below 9.52 to validate a near-term downside path toward 9.34–9.14.
- Observe changes in breadth and volatility signals, which may precede a more decisive directional move.
- Keep an eye on BTC/ETH ETF flow shifts as a broader market risk proxy, while keeping LINK’s own TA as the primary driver.
Hashtags: #LINK #crypto #trading #technicalanalysis #ETFflows #BTC #ETH #riskmanagement #marketstructure #volatility #levels #triggers