Market Snapshot
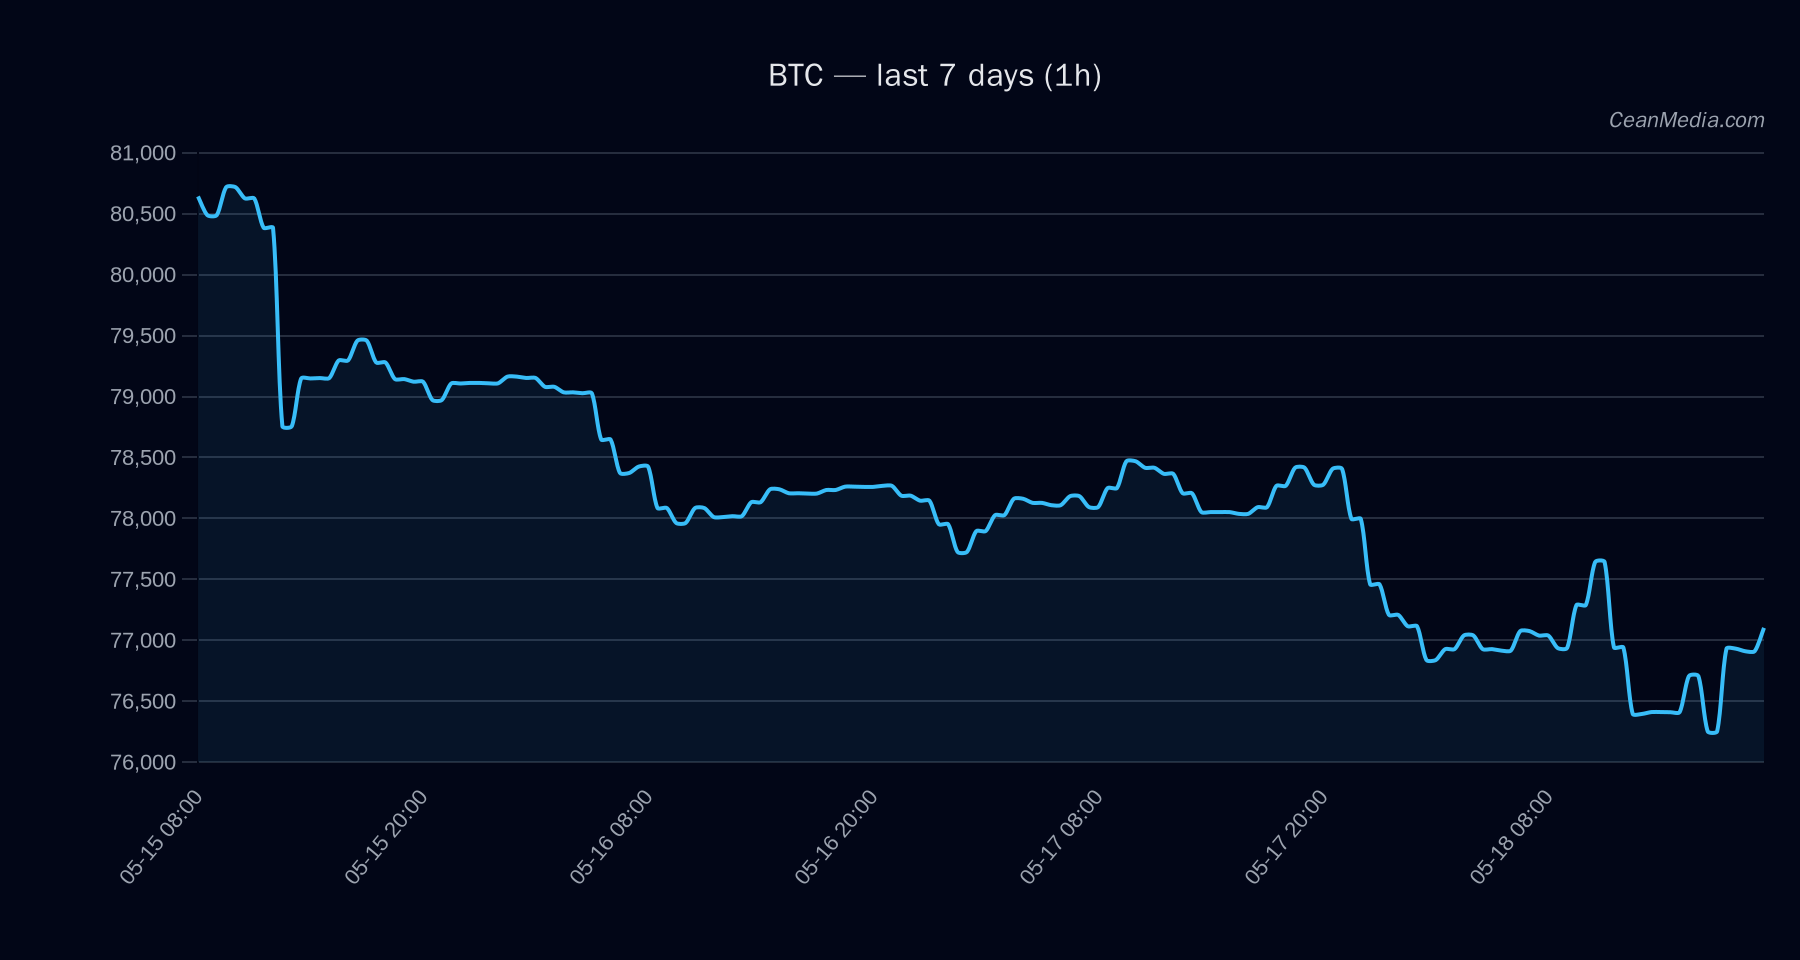
BTC sits in a tight range between support near 75,625 and resistance near 78,700. The latest formal view indicates a bearish bias with low certainty (40/100) and a composite score of -2.8. The 24-hour model forecast favors a sideways to mildly bearish outcome with a 45% probability of a move down, 13% sideways, and 42.7% up (rounded from 0.4266).
Technical Analysis: BTC
Bias and range: Bearish bias with a defined trading range: support at 75,625 and resistance at 78,700. Breaks above/below these levels imply directional targets.
- Current price (close): 77,166.25
- Key triggers:
- Upside: close > 78,700 within 1 hour triggers a path toward 80,283.77 – 81,857.96.
- Downside: close < 75,625 within 1 hour triggers a path toward 74,110.47 – 72,598.01.
- Technical trend: Bearish (EMA12
- Model forecast: Sideways (13%); Up 43%; Down 45% (asymmetric odds favoring downside slightly).
- Support / Resistance: Support near 75,625; Major support region around 74,110. Resistance near 78,700; Major resistance at 81,425.
- Invalidation: Not explicitly stated, but a break above 78,700 provides a bullish continuation; a break below 75,625 provides a bearish continuation.
- Momentum/Volatility context: Market breadth is 0% above SMA50, BTC.D at 58.2% (down 0.2% in 7d). Vol regime labeled as Very Low with ATR 284.15 and vol unit 355.18.
Drivers
Positive contribution from LS TOP Z-SCORE (6.13 value, 4.98 contrib); negative from LS GLOBAL Z-SCORE (5.90 value, -4.93 contrib); Stable market cap and other factors contribute modestly. Trend strength remains modest (value ~0.81); distance from MA around -1.06%, indicating a slightly negative stance relative to short-term averages. Cross-market risk assets have softened; Fear sentiment around 28, indicating cautious positioning. ETF flows show significant positive movement in BTC with supportive positioning, though this is context rather than a primary signal.
ETF Flows (BTC/ETH)
ETF flow data covers BTC and ETH. Current data shows:
+$629.8M (1D), +$198.4M (5D), +$585.2M (10D). +$101.2M (1D), -$20.8M (5D), +$81.6M (10D).
Interpretation: The ETF data presented reflects BTC and ETH flows and is context for market participation. It is not a primary signal for BTC direction. The combined flows indicate underlying demand in short to medium horizons, contributing to overall risk-on sentiment, but should be weighed alongside price action, volatility, and on-chain indicators.
What to Watch Next
- Watch for a close above 78,700 to validate a potential upside move toward 80,283.77 – 81,857.96.
- Monitor a close below 75,625 for confirmation of a downside sequence toward 74,110.47 – 72,598.01.
- Assess breadth and RSI readings in the next sessions to gauge any shift in momentum, given the Very Low volatility regime.
- Keep an eye on BTC ETF/ETH ETF flow dynamics as supplementary context, noting that ETF data is BTC/ETH-specific and not the sole driver for BTC pricing.
Hashtags: #Bitcoin #BTCAnalysis #TechnicalAnalysis #ETFFlows #MarketSnapshot #PriceAction #CryptoMarkets #Volatility #ETFFlows #BitcoinDXY #RiskOn #MarketContext