Market Snapshot
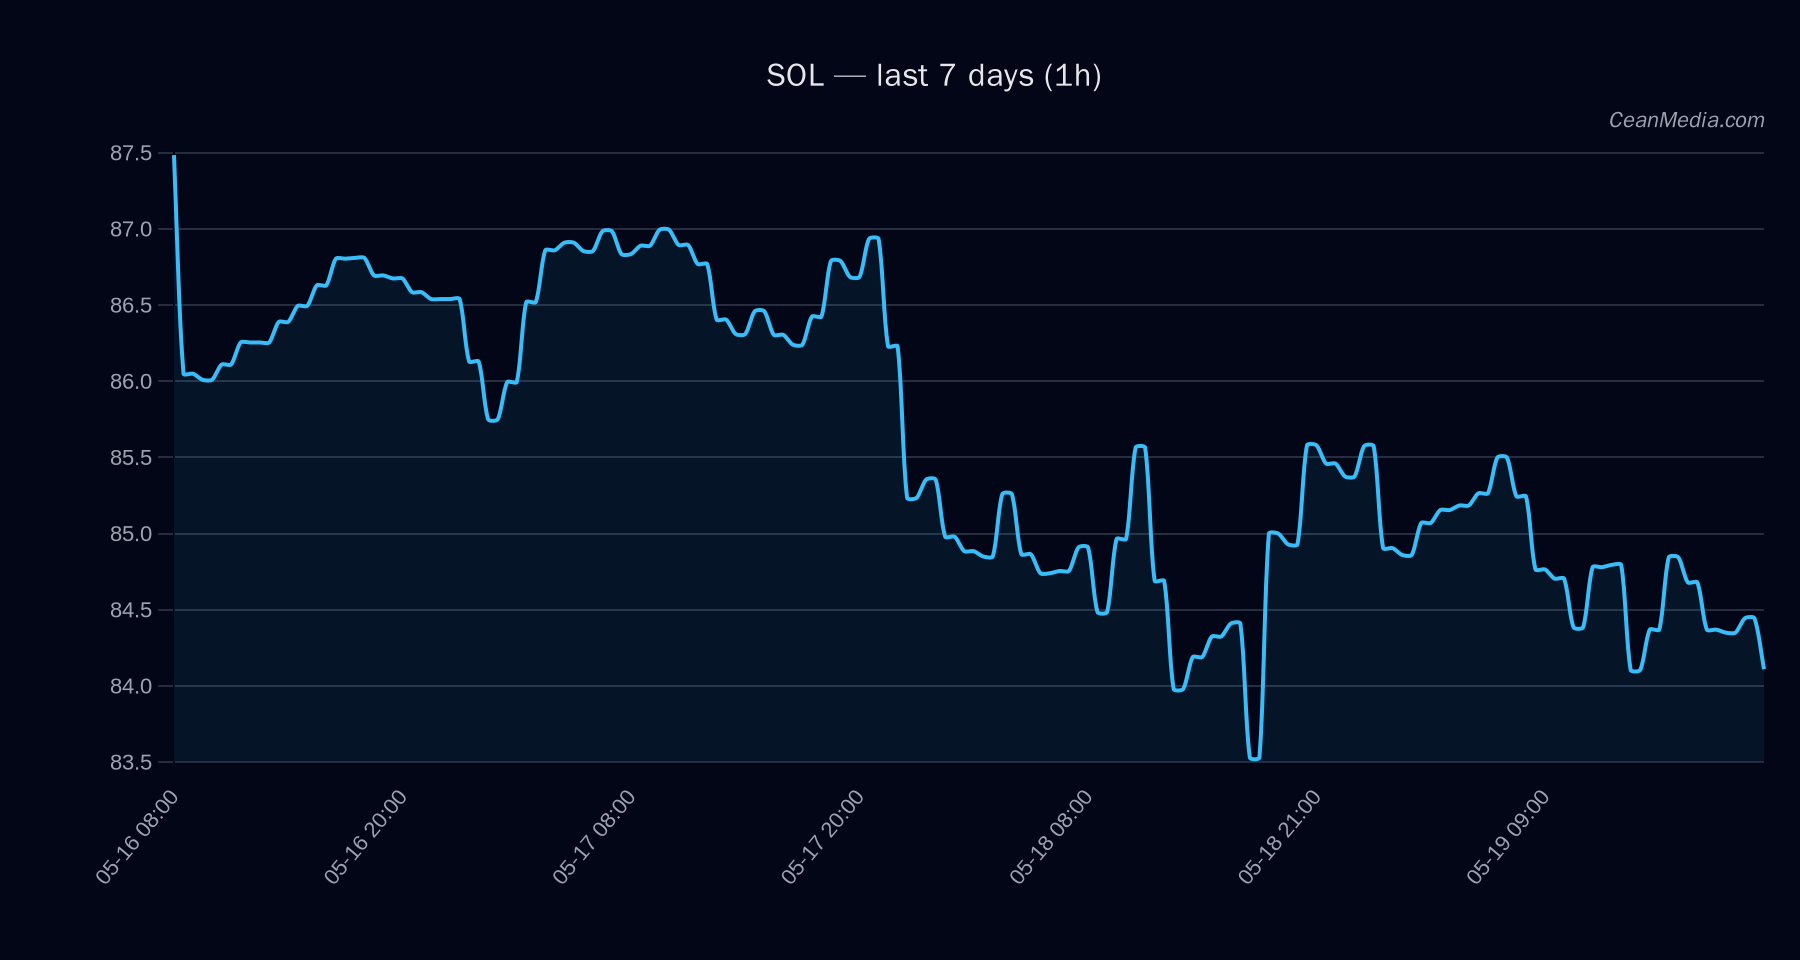
As of 2026-05-19, SOL is trading with subdued volatility in a context of broad risk-off sentiment. The instrument shows a bearish tilt in the near term with limited breakout potential given the current price action and macro signals. The most recent close sits around 84.26, within a defined range bounded by support near 82.6 and resistance near 85.9.
Market breadth is flat to negative, with a BTC-dominance backdrop (around 58.3%) contributing to a cautious risk posture. Overall sentiment indicators place market participants in the Extreme Fear band, consistent with lower-risk appetite for non-BTC risk assets.
Technical Analysis: SOL
: -5.1 : EMA12 < EMA26, SMA50 < SMA200, low 24h volatility (σ24h 0.34%), vol regime: very low
The forecast range indicates a p50 around 83.00 with a p20-p80 band of 79.33 to 85.85. Critical intra-range levels are:
Traders should monitor triggers for breakout/invalidations:
- Up trigger: 1h close > 85.9 → potential move toward 87.66–89.38
- Down trigger: 1h close < 82.6 → potential move toward 80.92–79.27
Invalidation note: The current setup is inside-range with no breakout confirmation; the bias remains bearish until a clear upside or downside breakout occurs.
Drivers
(contributions and values): - SPREAD Z-SCORE: +1.12 | value 1.93
- BTC DOMINANCE: +0.60 | value 2.02
- RV 24H: -0.56 | value -0.97
- FUNDING Z-SCORE: +0.51 | value -3.84
- BTC RV 24H: +0.45 | value -1.13
- FNG DELTA 7D: +0.42 | value -19.2
Momentum/volatility context: Market breadth is flat (0% above SMA50), BTC dominance remains elevated, and the volatility regime for SOL is very low with modest intraday ranges. The broader Fear/Greed signal sits in Extreme Fear (25), reinforcing a cautious stance for risk assets beyond BTC.
ETF Flows (BTC/ETH)
Contextual ETF flow data for BTC and ETH is provided to gauge risk-on/off sentiment and does not constitute a primary signal for SOL. As of the latest data:
: +$629.8M (1D), +$198.4M (5D), +$585.2M (10D) : +$101.2M (1D), -$20.8M (5D), +$81.6M (10D)
Interpretation: BTC ETF flows show sustained inflows, consistent with a risk-on/off cycle where stronger BTC participation may compress risk-off risk or act as a hedge for alternative assets. ETH shows smaller net flows and more mixed signals. These ETF numbers are context drivers and should not be treated as SOL-specific signals, but they contribute to the macro backdrop in which SOL operates.
What to Watch Next
- Watch for a clean close above 85.9 to confirm a potential bullish extension toward 87.66–89.38.
- If SOL breaks below 82.6 on a sustained basis, monitor for a move toward 80.92–79.27.
- Monitor market breadth and BTC dominance for signs of a risk-on/off shift that could impact SOL’s volatility and correlation with BTC.
- Track updated ETF flow signals for BTC/ETH as supplementary context for risk sentiment, while maintaining SOL-specific levels as primary guidance.
Hashtags: #Solana #SOL #CryptoAnalysis #TechnicalAnalysis #MarketSnapshot #ETFFlows #BTC #ETH #RiskOn #MarketSentiment #CryptoTrading