Market Snapshot
Solana (SOL) traded around the mid-80s to high-80s intraday as of 2026-05-22. The composite signal shows a mixed/neutral bias with low confidence. Market breadth remains robust above the 50-day average, and BTC dominance trends modestly lower over the past week. ETF flows into BTC/ETH have shifted risk sentiment toward a cautious risk-on backdrop, though these flows are not the primary signal for SOL trading decisions.
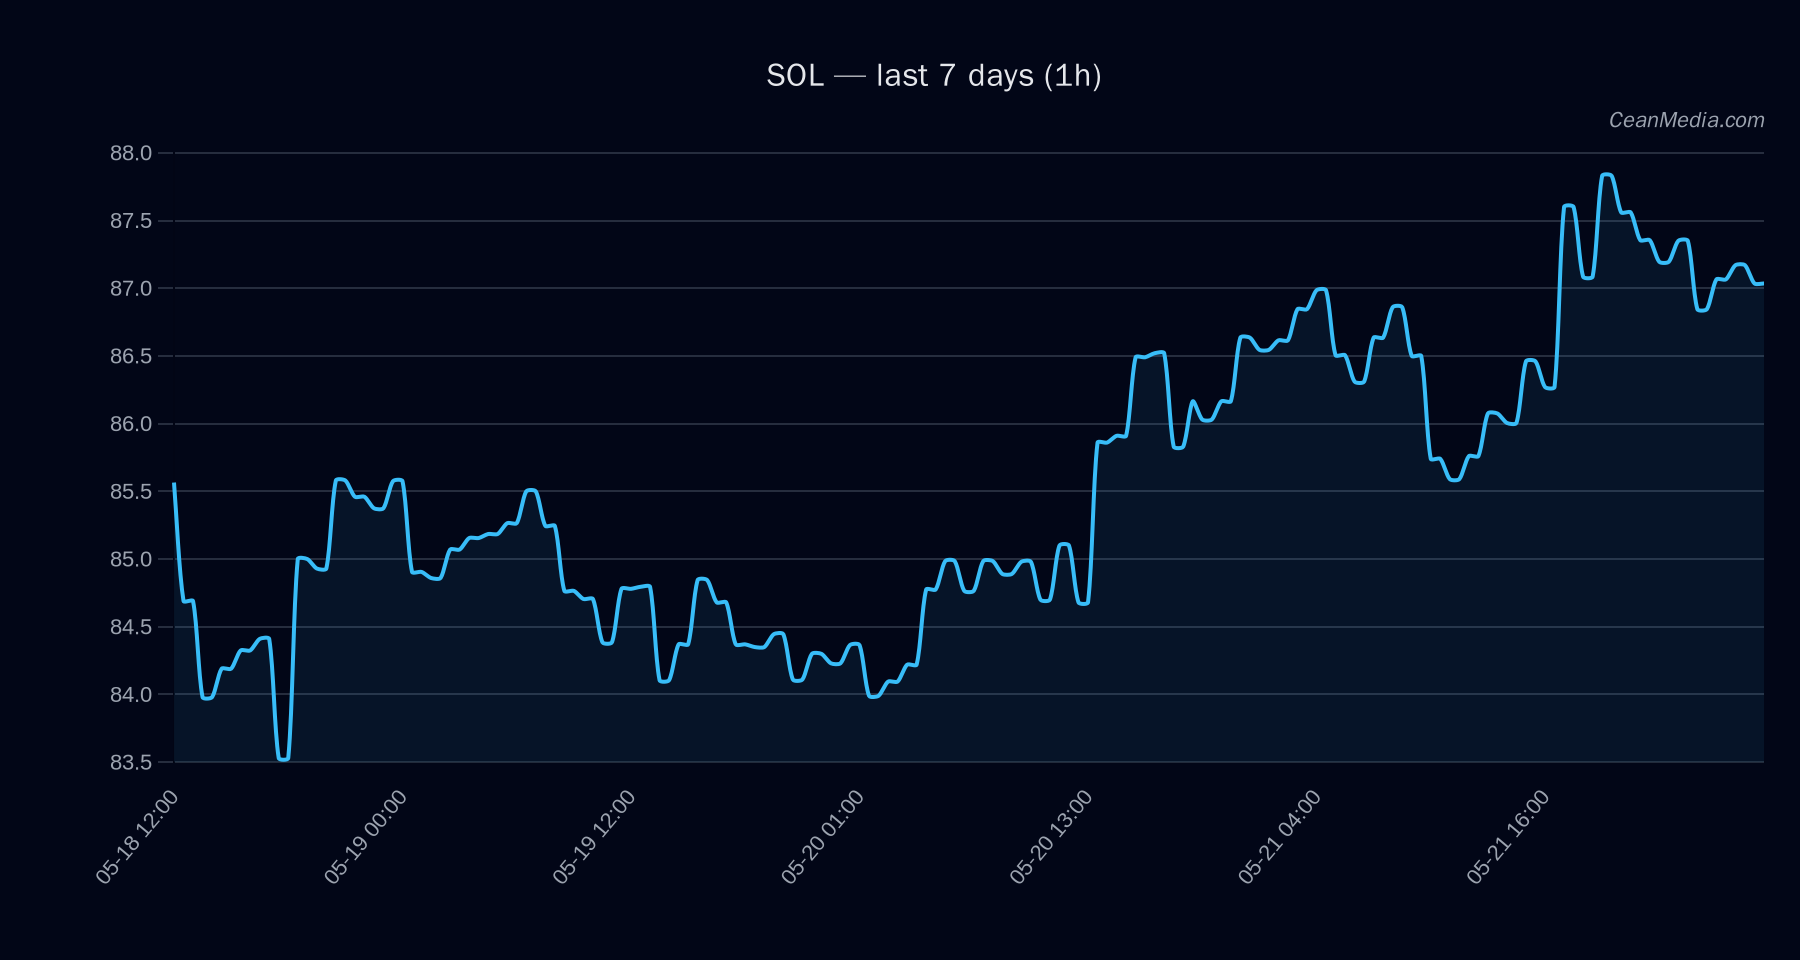
Technical Analysis: SOL
+0.7, conflicts 0 87.19 Sideways - RSI: 56
- EMA/SMA Alignment: EMA12 > EMA26, SMA50 < SMA200
- Volatility Regime: Very low (σ24h 0.51%)
- Key Levels: Support near 85.4, major support at 84.9; Resistance near 88.9, major resistance at 92.5
- Forecast Range (P50): 86.5343
- Triggers:
- Up: 1h close > 88.9 → potential targets 90.7125 and 92.4912
- Down: 1h close < 85.4 → potential targets 83.7373 and 82.0284
- Invalidation/Context: Breakouts above 92.5 or below 84.9 would warrant re-evaluation of the current setup.
Drivers
Stable MCAP log1p, BTC dominance, VIX z-score, RV 7D, and BTC RV 24H Very low volatility regime; breadth is favorable with 100% above SMA50 Taker flow is balanced; positioning indicates long crowding (1.70x)
ETF Flows (BTC/ETH)
Contextual signal: ETF inflows are reported for BTC and ETH, not SOL. BTC ETFs show notable intraday gains across 1D, 5D, and 10D horizons, suggesting systemic demand for BTC exposure. ETH ETF flows are positive on 1D but negative on 5D, with smaller magnitude overall. These flows provide a broad risk-on/off context but are not used as a primary signal for SOL price action.
+$629.8M (1D), +$198.4M (5D), +$585.2M (10D) +$101.2M (1D), -$20.8M (5D), +$81.6M (10D)
Note: ETF data here reflects BTC/ETH exposure and should be interpreted as macro risk-on/off context rather than a SOL-specific trading signal.
What to Watch Next
- Watch for a close above 88.9 to validate potential upside acceleration toward 90.7–92.5 range.
- Monitor a break below 85.4 for invalidation and potential move toward 83.7–82.0 levels.
- BTC dominance trajectory and overall market breadth remain supportive, which could correlate with SOL strength in the short term.
- Volatility regime remains very low; consider waiting for a clear breakout or a consolidation pattern before initiating aggressive exposure.
Hashtags: #SOL #Solana #CryptoAnalysis #MarketSnapshot #TechnicalAnalysis #ETFFlows #BTC #ETH #CryptoFlows #MarketContext #PriceAction