Market Snapshot
As of 2026-05-22, BTC trades within a narrow range with a bearish technical tilt despite a measured upside forecast. Market breadth is weak, and trading activity is characterized by very low volatility. ETF flows show positive positioning in BTC and ETH at multiple horizons, providing context for risk-on sentiment but not serving as a primary signal for BTC direction.
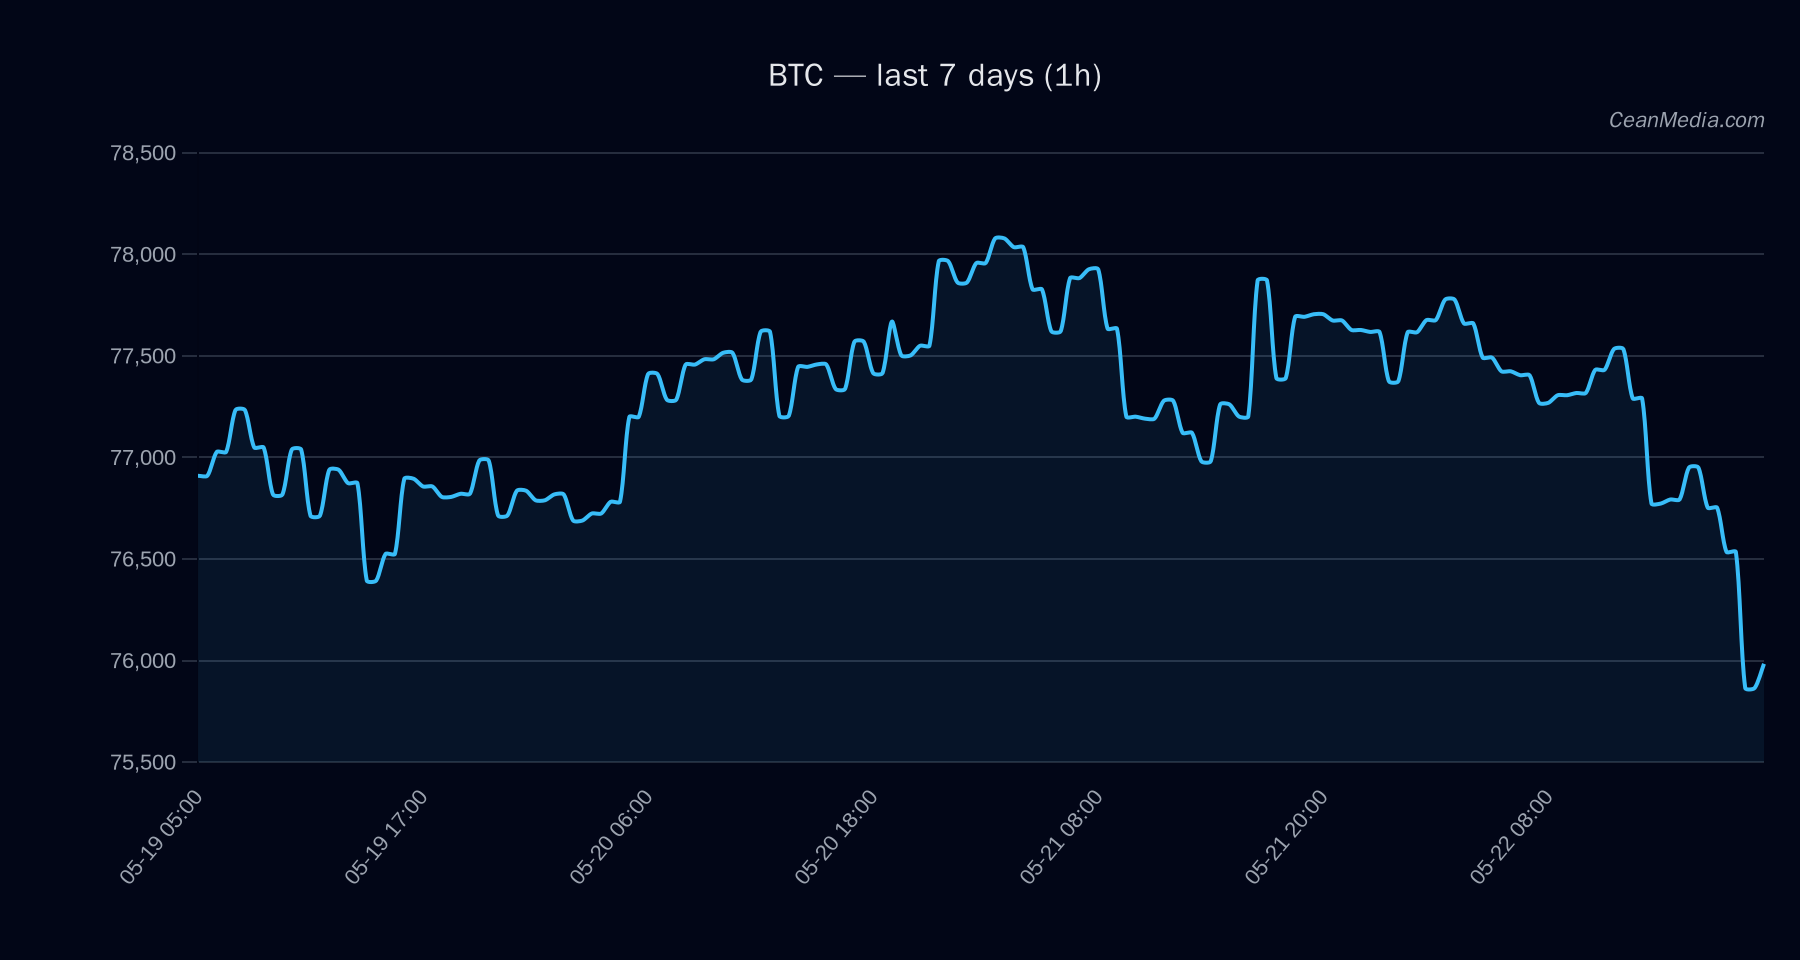
Technical Analysis: BTC
- Bearish with high certainty (78/100).
- -5.4 (conflicts 0).
- 75,965.15
- Bearish (EMA12 < EMA26; SMA50 < SMA200; RSI 28; Vol regime: Very low; σ24h 0.26%).
- 28 (oversold territory).
- Model indicates 48% probability of up, 31% down, 22% sideways; overall bias remains bearish at current levels.
-
- Support near 74,450
- Major support at 72,956
- Resistance near 77,475
- Major resistance at 79,600
-
- Up: 1h close > 77,475 → 79,034.14 to 80,583.83
- Down: 1h close < 74,450 → 72,956.93 to 71,468.01
- BTC sits between 74,450 support and 77,475 resistance. RSI oversold condition persists, suggesting potential near-term relief if support holds.
Drivers
-
- RV 7D: modest contribution with value 1.82–1.93 range
- LS TOP Z-SCORE and LS GLOBAL Z-SCORE indicate mixed momentum signals
- F&G (Fear) index around 28
- Very low volatility regime; Volume regime shows minimal activity. BTC.D dominance around 58.1% with a slight decline over 7 days.
- Taker flow shows selling pressure; order book is ask-heavy; long liquidations observed, indicating cautious sentiment in the near term.
ETF Flows (BTC/ETH)
ETF flow data covers BTC and ETH only and should be interpreted as context for risk appetite rather than a primary signal for BTC price action.
- 1D +$629.8M; 5D +$198.4M; 10D +$585.2M
- 1D +$101.2M; 5D -$20.8M; 10D +$81.6M
Interpretation: The positive ETF flows, particularly for BTC on longer horizons, suggest a degree of institutional risk-on appetite. While supportive for general market sentiment, ETF data should not be treated as the primary driver for BTC price movements, given the current technical indicators pointing to a bearish bias in the near term.
What to Watch Next
- Key breakout resistance at 77,475: a daily close above this level would shift near-term dynamics toward 79,034–80,584.
- Critical support at 74,450: a break below this level opens the path toward 72,956 and 71,468.
- Maintain awareness of ETF flow momentum in BTC/ETH, as sustained inflows could temper downside risk or support a broader market rally beyond local resistance.
- RSI remains in oversold territory; look for any RSI trend reversal confirming a shift in momentum before committing to new long exposure.
Hashtags: #BTC #Bitcoin #TechnicalAnalysis #ETFFlows #MarketSnapshot #CryptoMarkets #TradingView #CryptoNews #RiskOn #Liquidity #Volume #Volatility