Market Snapshot
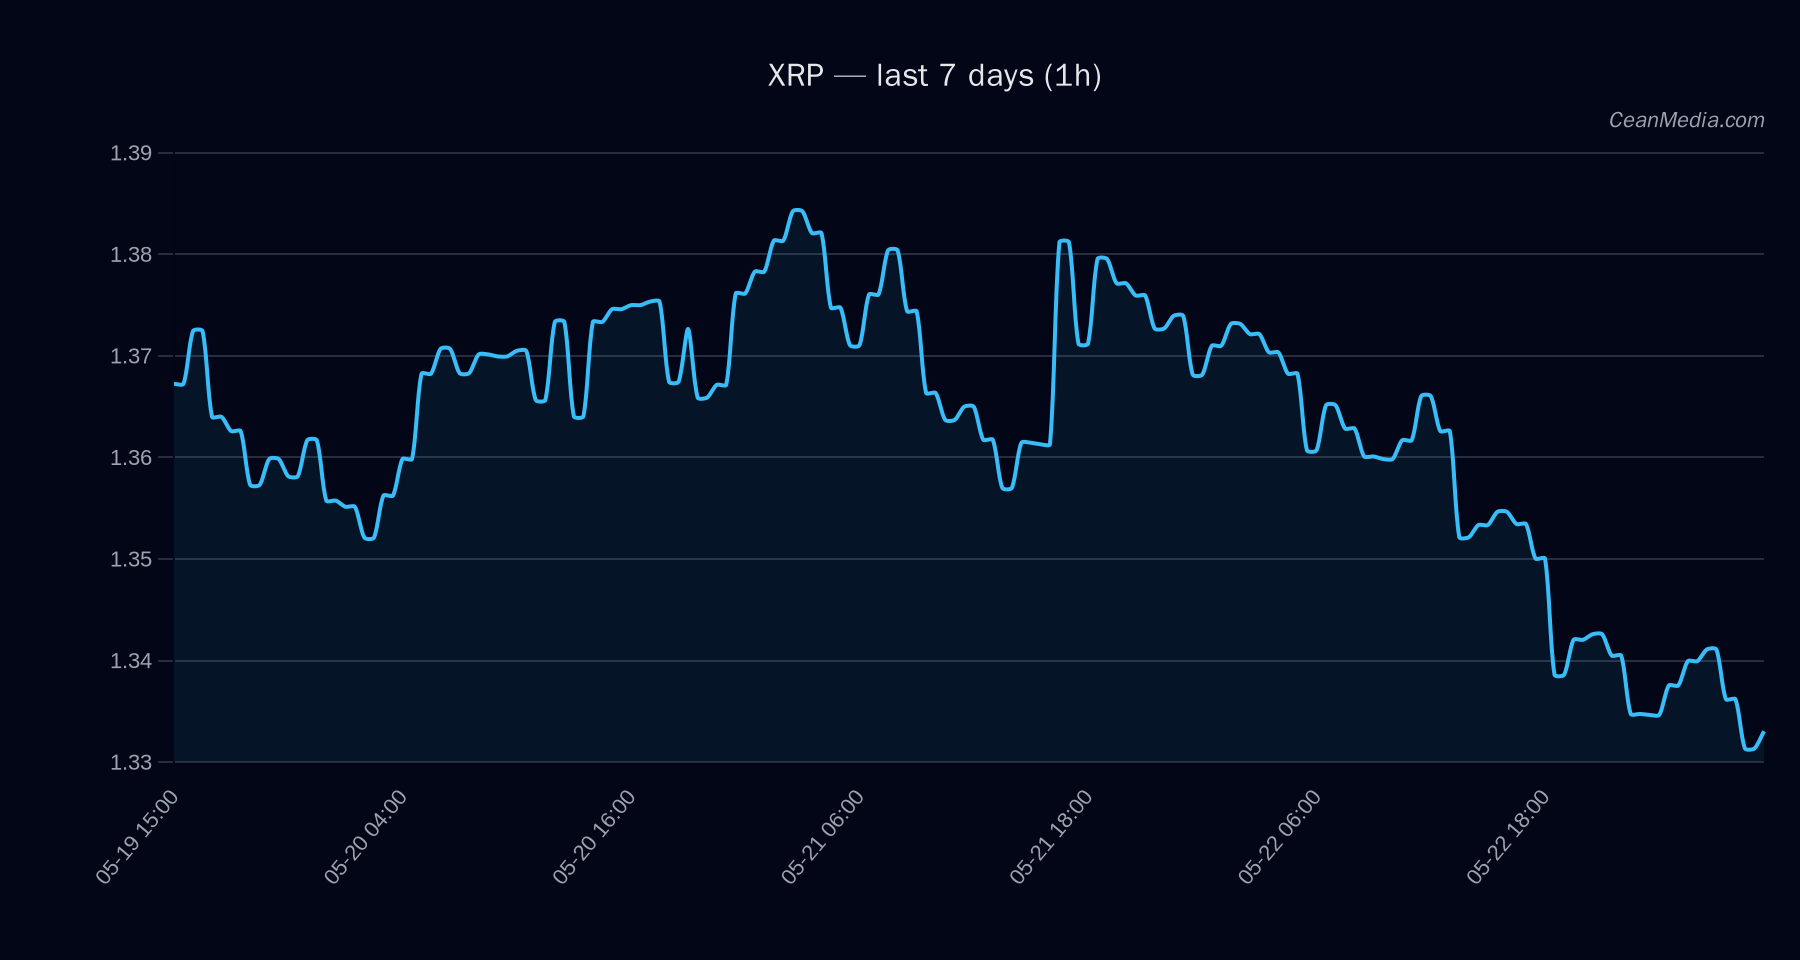
As of 2026-05-23, XRP trades around 1.331 with a bearish tilt in the near term. The composite view signals a high-certainty bearish bias (84/100) and a final model forecast of downside pressure. Price sits between critical levels, with the nearest support near 1.30 and resistance near 1.36. Market breadth is weak, and the volatility regime is very low.
Technical Analysis: XRP
-5.9 (conflicts 0) 1.331 EMA12 < EMA26, SMA50 < SMA200, RSI 31, 24h volatility σ24h = 0.30%, very low volatility regime 1.3163 1.3064 – 1.4162
- Up: 1h close > 1.36 → 1.3848 / 1.4119
- Down: 1h close < 1.3 → 1.2783 / 1.2522
Context: Breadth is flat (0% above SMA50); BTC dominance trend modestly negative over 7 days. Relative strength index remains in oversold territory, corroborating a cautious stance rather than a bullish reversal.
Drivers
SPREAD BP, SPREAD Z-SCORE, LIQ TO OI EMA12, LIQ IMB EMA12, VOL OF VOL, BTC DOMINANCE Very low vol regime; liquidity indicators show long exposure but with some selling pressure and crowded long positioning (1.71x). 24h return -0.02, EMA slope negative, funding and basis z-scores negative, BTC 24h return -0.026 and BTC dominance ~58.0%
ETF Flows (BTC/ETH)
Note: ETF flow data shown here pertains to BTC and ETH only and is provided as market context for risk appetite. It should not be treated as a primary signal for XRP trading decisions. The snapshot indicates ongoing accumulation in BTC/ETH ETFs, which can reflect broader risk-on sentiment or hedging activity in crypto markets.
+$629.8M (1D); +$198.4M (5D); +$585.2M (10D) +$101.2M (1D); -$20.8M (5D); +$81.6M (10D)
What to Watch Next
- Watch for a close above 1.36 on a 1-hour basis to confirm a potential short-term recovery toward 1.3848–1.4119.
- Monitor if XRP breaks 1.30 decisively on a close to assess risk of a move toward 1.2783–1.2522.
- Keep an eye on BTC dominance and BTC ETF flows as markers of risk-on/off sentiment, given their influence on correlated assets.
- Assess changes in liquidity metrics (LIQ TO OI EMA12, LIQ IMB EMA12) for signs of shifting order-book dynamics.
Hashtags: #XRP #CryptoAnalysis #MarketSnapshot #TechnicalAnalysis #ETFFlows #BTC #ETH #BearishBias #PriceAction #Liquidity #RiskOn #MarketContext