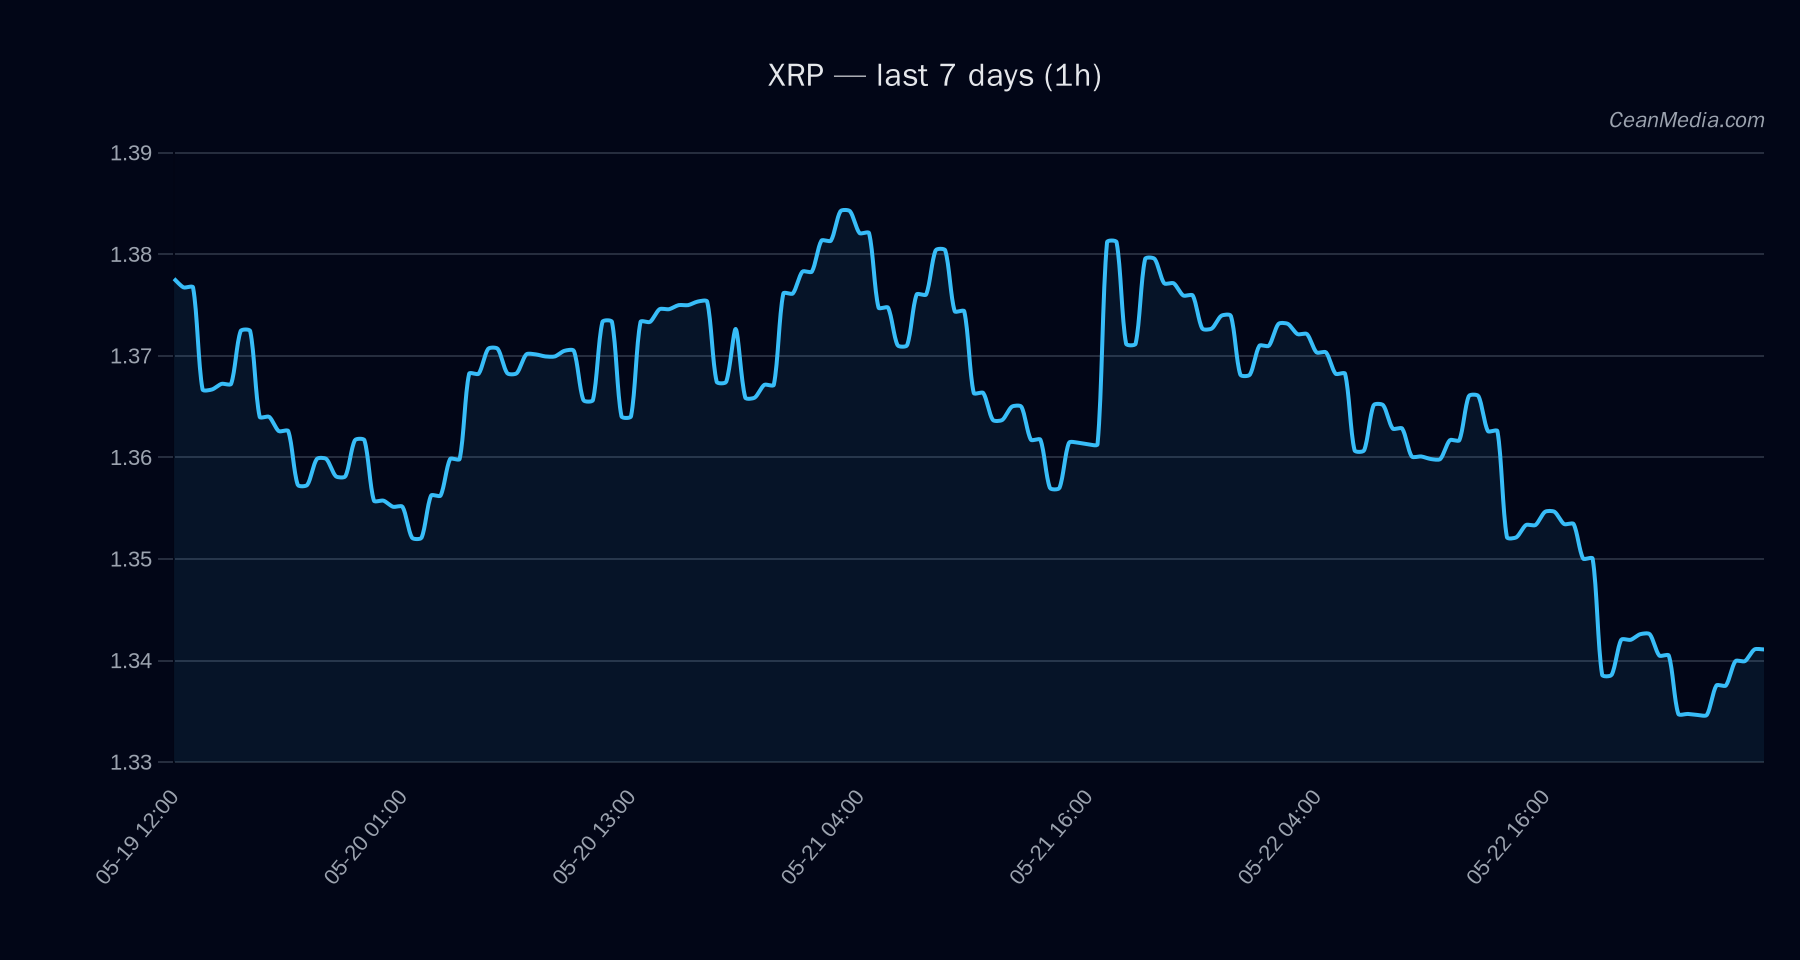
Market Snapshot
As of 2026-05-23, XRP trades near key technical levels with a bearish tilt in the near term. The model assigns a down-facing forecast with the closest near-term support around 1.30 and resistance near 1.36, within a very low volatility regime.
Technical Analysis: XRP
: P50 around 1.315; P20-P80 from 1.313 to 1.4295. - Upside: 1h close > 1.36 to target 1.3899 / 1.4171.
- Downside: 1h close < 1.30 to target 1.283 / 1.2568.
Drivers
- Top model drivers suggest negative near-term momentum with a tilt from liquidity metrics (EMA12-OI, order-book imbalances) and funding/basis sentiment.
- Key observations include negative EMA slope, negative basis z-score, and negative 24h return contributions.
- Volatility regime remains very low, contributing to subdued price movement and higher reliance on trigger levels for confirmation.
- BTC dominance context shows a slight downward trend over 7 days, aligning with risk-off/macro caution signals feeding into XRP’s bearish tilt.
ETF Flows (BTC/ETH)
Contextual support signals from BTC and ETH ETF flows are provided for market breadth and risk sentiment, but they are not used as a primary signal for XRP. Current data shows:
- BTC ETFs: +$629.8M for 1D, +$198.4M for 5D, +$585.2M for 10D
- ETH ETFs: +$101.2M for 1D, -$20.8M for 5D, +$81.6M for 10D
Interpretation: Overall ETF inflows in BTC/ETH suggest a constructive appetite for risk assets in the broader market on short horizons, which can lend a supportive backdrop to riskier assets. However, the XRP-specific setup remains driven by its internal technicals and liquidity dynamics. ETF data is context-only and should not be treated as a primary XRP signal.
What to Watch Next
- Monitor 1h closes around 1.36 for a potential breakout toward 1.39–1.42 if triggered.
- Watch for a break below 1.30 to validate downside targets toward 1.283–1.2568.
- Keep an eye on liquidity-constrained conditions (Very Low vol) that can amplify moves once trigger levels are crossed.
- Observe BTC dominance and cross-market sentiment for potential spillover effects on XRP’s momentum.
Hashtags: #XRP #CryptoAnalysis #MarketUpdate #TechnicalAnalysis #ETFFlows #BTC #ETH #RiskOn #PriceAction #Liquidity #Momentum #Altcoins