
Market Snapshot
- Asset: ETH
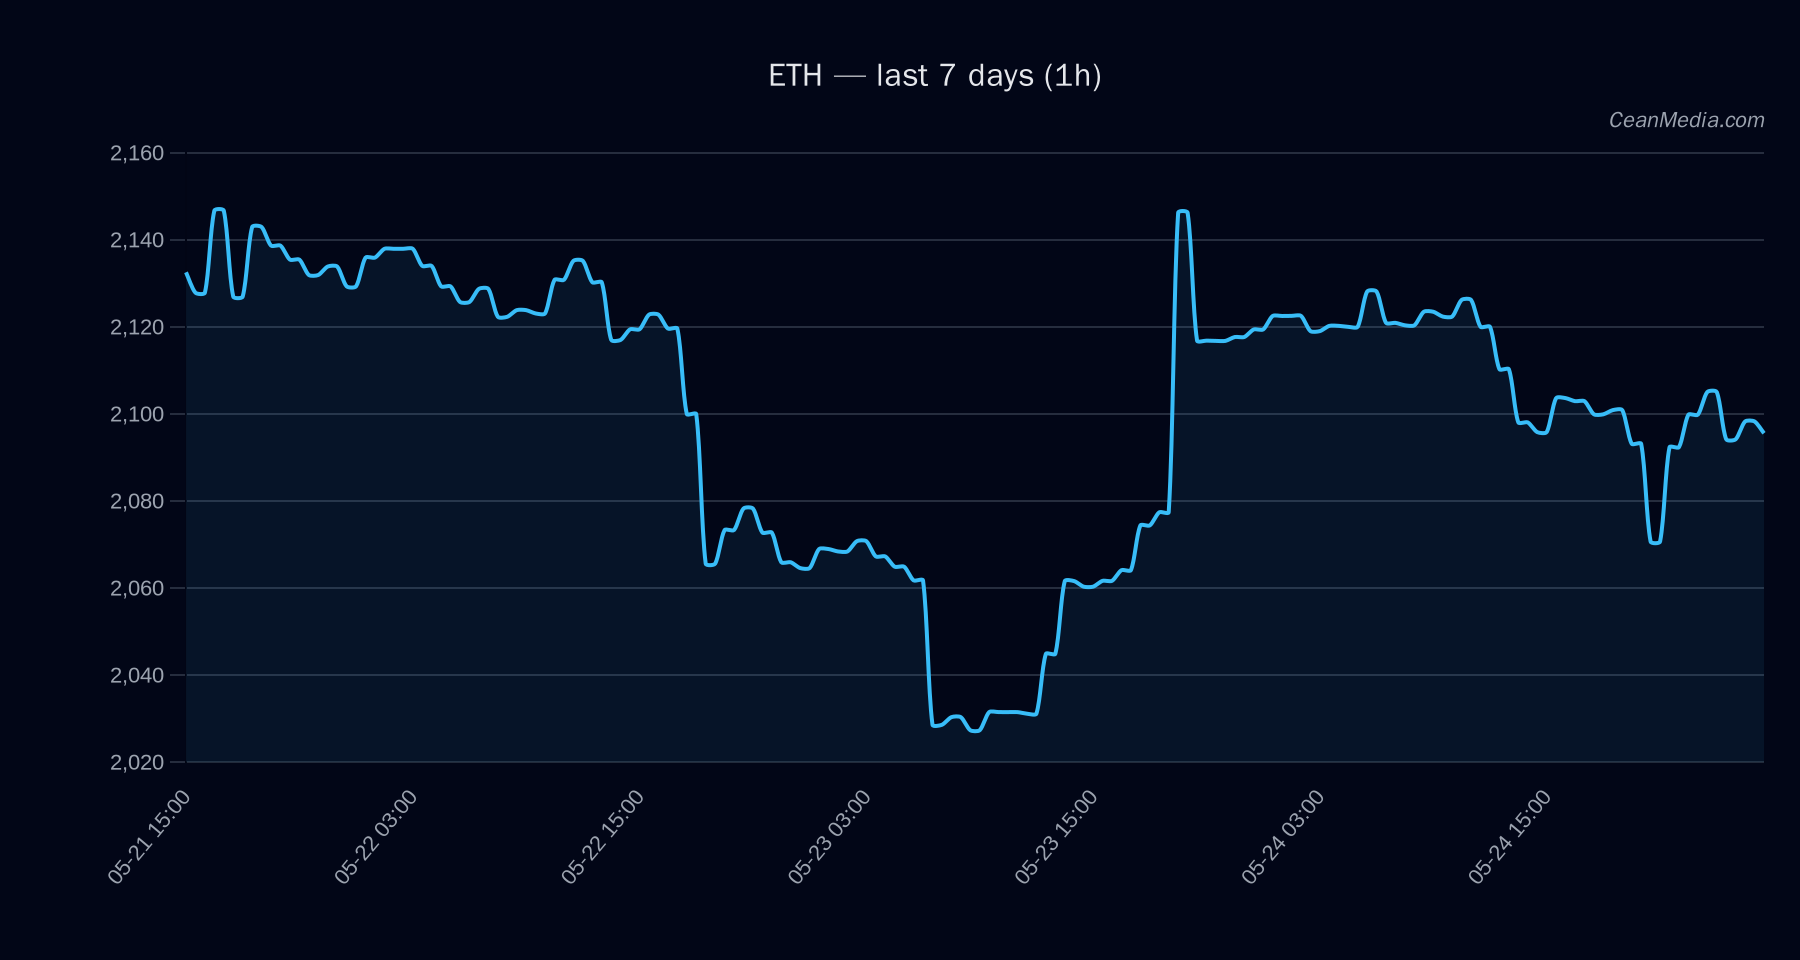
- Close Price: 2,094.35 (as of 2026-05-25)
- Volatility regime: Very low; ATR: 7.89; Vol unit: 9.86
- BTC correlation (72h): 0.95
Technical Analysis: ETH
-3.6 Bearish; RSI 47 EMA12 < EMA26; SMA50 < SMA200; σ24h 0.41%; Vol regime: Very low 2,090.16 / 2,014.69 – 2,142.10 - Upside: 1h close above 2,136 targets 2,178.96 – 2,221.69
- Downside: 1h close below 2,052 targets 2,011.41 – 1,970.36
Drivers
BREAKOUT 7D (+0.65), BTC Dominance (+1.85) contributing to risk-off context, RV (7D) and RV (24H) providing mixed signals Vol regime is Very low; 50% breadth above SMA50; BTC correlation strong (0.95). Fear index around 30. Cross-market risk assetsSoft; Stablecoin liquidity contracting over 7D
ETF Flows (BTC/ETH)
Context note: ETF flows data shown here pertains only to BTC and ETH ETFs and is provided as contextual backdrop; it should not be treated as a primary signal for ETH price action.
1D +$629.8M; 5D +$198.4M; 10D +$585.2M 1D +$101.2M; 5D -$20.8M; 10D +$81.6M
What to Watch Next
- Monitor 1h closes around 2,136 as a near-term resistance checkpoint.
- Watch for a break below 2,052 for confirmation of renewed downside pressure toward 2,011–1,970.
- Observe ETF flow dynamics in BTC/ETH as contextual risk-on/off signals but avoid treating ETF data as ETH-specific trigger.
- Keep an eye on GT/volatility regime changes that could shift the current very low volatility backdrop.
Hashtags: #ETH #Ethereum #CryptoAnalysis #MarketInsights #TechnicalAnalysis #ETFFlows #BTC #AltMarkets #PriceAction #RiskManagement #MarketContext #TradingStrategy