Market Snapshot
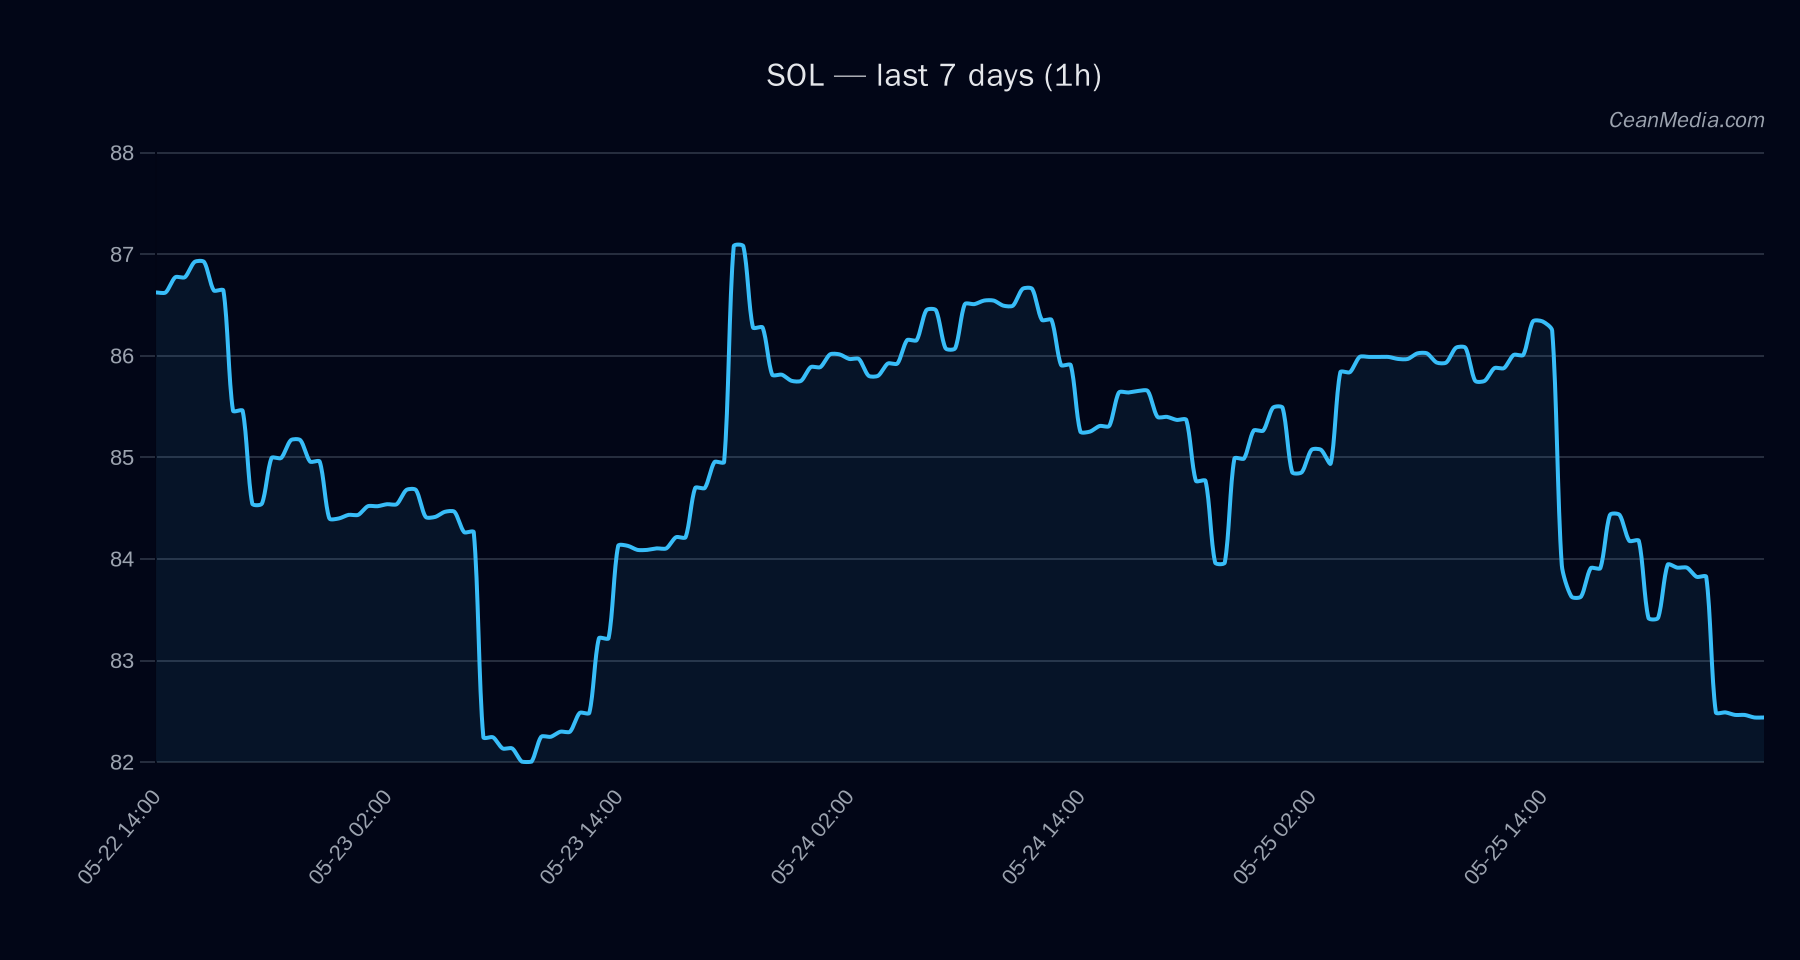
Date: 2026-05-29 | Primary Asset: SOL
Current price: 82.44. The model presents a bearish bias with high certainty (79/100) and a composite score of -5.5. Market breadth is weak, volatility is very low, and the current regime suggests limited intraday breakout potential unless key levels are breached.
Technical Analysis: SOL
- Bearish (high certainty 79/100).
- Close at 82.44.
- EMA12 < EMA26, SMA50 < SMA200, RSI at 31 (oversold territory). Implied volatility (σ24h) 0.73%, vol regime: Very low.
- Model indicates Up 49% probability, with Down 41% probability and Sideways 11%.
-
- Support near 80.8 (major 84.4 as a resistance)
- Resistance near 84.1 (major 89.8)
- Up: 1h close > 84.1 targets 85.77–87.45. Down: 1h close < 80.8 targets 79.18–77.56.
- Price remains within 80.8–84.1 unless a breakout occurs; no breakout confirmation at present.
Drivers
- EMA slope negative; funding and basis z-scores skew negative; order-book imbalance shows modest negative pressure; BTC dominance elevated though with some recent delta; other macro indicators point to risk-off tendencies and extreme fear in sentiment data.
- Very low vol regime; breadth is flat, BTC correlation strong (ρ 0.92 over 72h); overall risk-off context in broader markets may constrain SOL upside in near term.
- The TA picture aligns with a bearish tilt, though a defined trigger exists above 84.1 for a potential short-term move higher if confirmed.
ETF Flows (BTC/ETH)
Contextual note: ETF flow data provided here pertains to BTC and ETH ETFs only and is not a primary signal for SOL. The flows indicate risk-on/off sentiment in broader crypto markets but should be integrated cautiously into SOL-specific analysis.
- 1D +$629.8M, 5D +$198.4M, 10D +$585.2M
- 1D +$101.2M, 5D -$20.8M, 10D +$81.6M
What to Watch Next
- Monitor 1h closes around 84.1 to confirm a potential breakout above resistance.
- If price breaks below 80.8, watch for downside targets toward 79.2–77.6.
- Keep an eye on BTC/ETH ETF flow momentum as a broader risk-on/off proxy, while recognizing SOL-specific signals remain primary.
- RSI remains in oversold territory; any bullish reversals should be confirmed with a sustained close above key moving averages (e.g., EMA12/EMA26).
Hashtags: #Solana #SOL #CryptoAnalysis #TechnicalAnalysis #ETFFlows #BTC #ETH #MarketSnapshot #TradingSetup #PriceLevels #RiskOnOff