
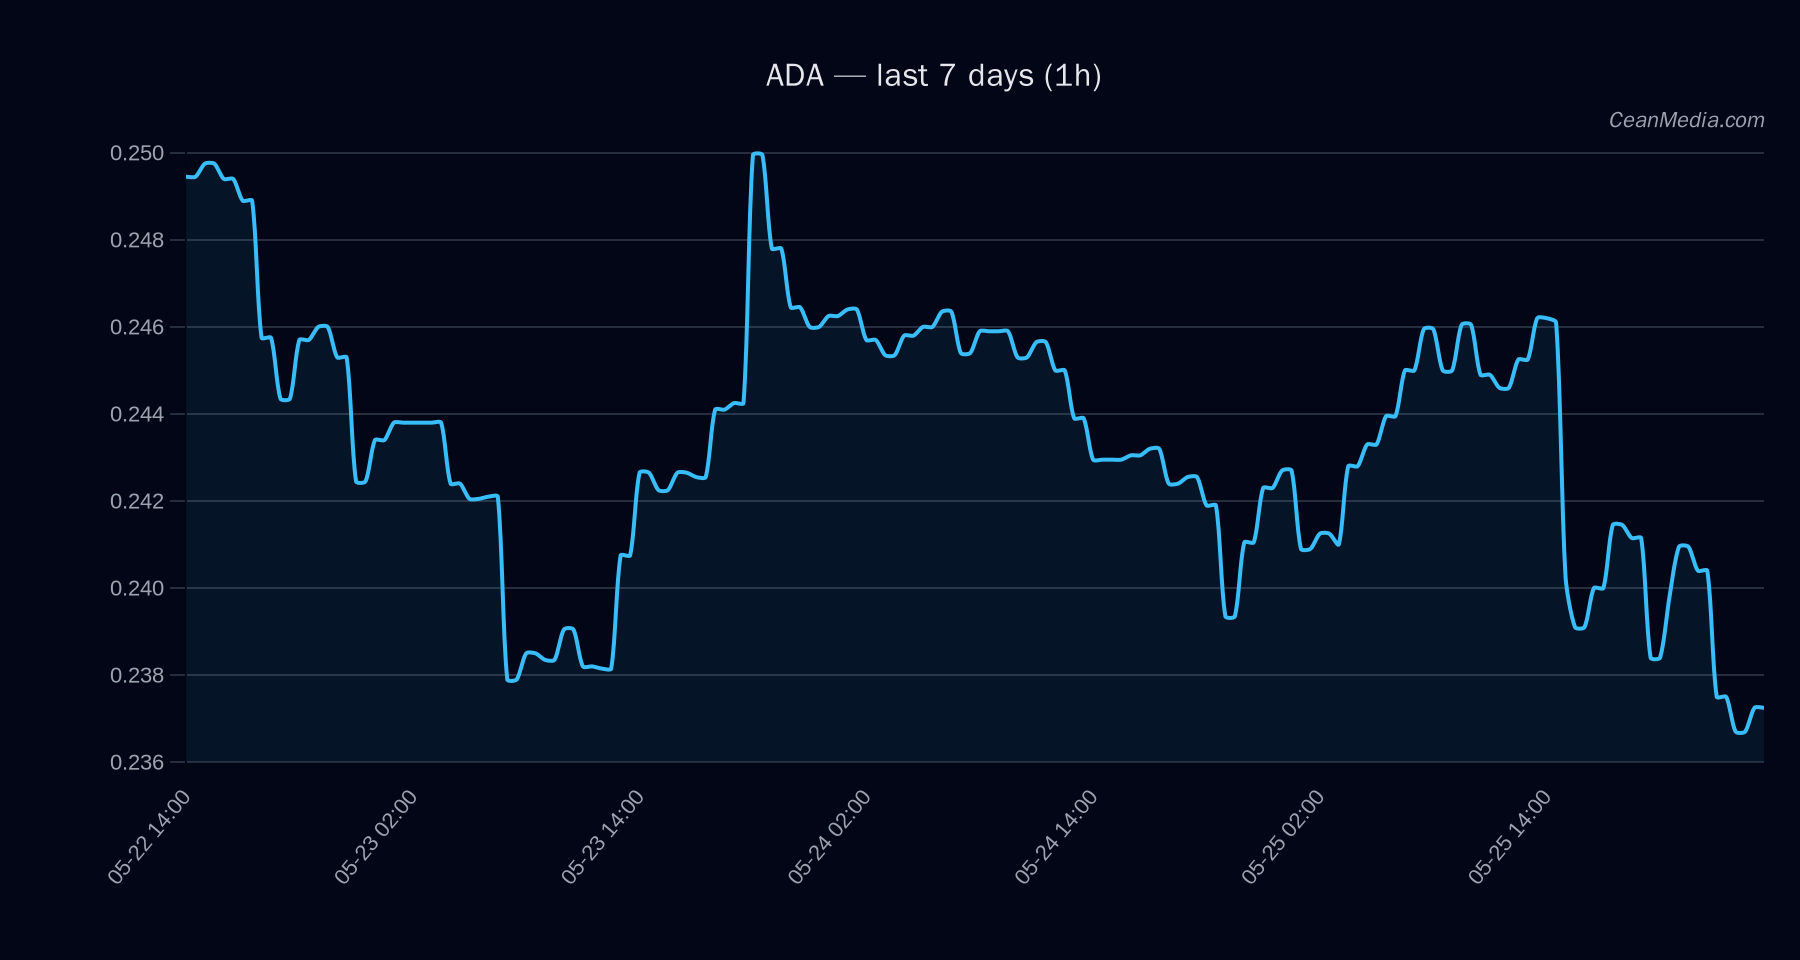
Market Snapshot
As of 2026-05-28, ADA sits in a narrow intra-range with price near 0.2375. Market context shows very low volatility and mixed flows from broader risk assets. BTC/ETH ETF flows are modestly supportive, while on-chain and cross-market signals for ADA remain uncertain, warranting a cautious stance until a clearer directional trigger forms.
Technical Analysis: ADA
- Price (Close): 0.2373
- Bias: mixed / bearish pressure; certainty low (5/100)
- Composite score: -2.8 | conflicts 3
- Trend Signals: TA trend bearish; RSI 37
- Key Averages: EMA12 < EMA26; SMA50 < SMA200
- Volatility: σ24h 0.70%; Vol regime: Very low
- Forecast: Up has 61% probability; Sideways 14%; Down 25%
- Forecast Range: P50 0.2384; P20-P80 0.2319–0.2422
- Support / Resistance: Support near 0.235; major 0.245; Resistance near 0.24; major 0.26
- Triggers: Up: close > 0.24 -> 0.2468/0.2517; Down: close < 0.235 -> 0.2279/0.2232
- Context: Breadth: 0% above SMA50; BTC correlation: 0.90; F&G: 22 (Extreme Fear)
- Top Model Drivers: Spread BP, RV 7D, NASDAQ100 RET 5D, Stable MCAP, SP500 RET 5D, VIX Z-SCORE
Invalidation note: The report states that evidence is not aligned and a trigger confirmation is required before adopting high-conviction directional bias. Traders should monitor for a close above 0.24 for upside confirmation or a close below 0.235 for downside invalidation.
Drivers
EMA slope (-0.00180), Basis Z-Score (0.352), Funding Z-Score (-0.989), OB/EMA5 imbalance (-0.011) Very low vol regime; RV_7D modest positive signal but overall risk-off environment persists (Extreme Fear in F&G) -0.025 external distance from moving averages, suggesting slight underperformance vs major averages
ETF Flows (BTC/ETH)
The ETF flow data provided relates to BTC and ETH only and should be interpreted as context, not a primary signal for ADA. The latest data show:
- BTC ETF: +$629.8M (1D), +$198.4M (5D), +$585.2M (10D)
- ETH ETF: +$101.2M (1D), -$20.8M (5D), +$81.6M (10D)
Interpretation: Net positive flows into BTC/ETH ETFs over recent horizons can reflect a general risk-on appetite or hedging demand in the broader crypto market. However, ADA-specific signals remain distinct and are not directly inferred from ETF flows. The BTC/ETH flow context should be considered as supplementary backdrop to ADA technicals.
What to Watch Next
- Monitor for a 1-hour close above 0.24 as a potential bullish trigger toward the 0.2468–0.2517 range.
- Watch for a 1-hour close below 0.235 to evaluate downside risk toward 0.2279–0.2232.
- Observe updated market breadth and correlation shifts with BTC over the next sessions, given the current very low volatility regime.
- Remain cognizant of broader risk-on/off swings in BTC/ETH ETF flows as a contextual backdrop for ADA moves.
Hashtags: #ADA #Cardano #CryptoAnalysis #MarketSnapshot #ETFFlows #CryptoTrading #TechnicalAnalysis #PriceAction #Volatility #MarketContext #RiskOn #RiskOff
Disclaimer: ETF data shown pertains to BTC/ETH only and serves as market context rather than a primary ADA signal.