
Market Snapshot
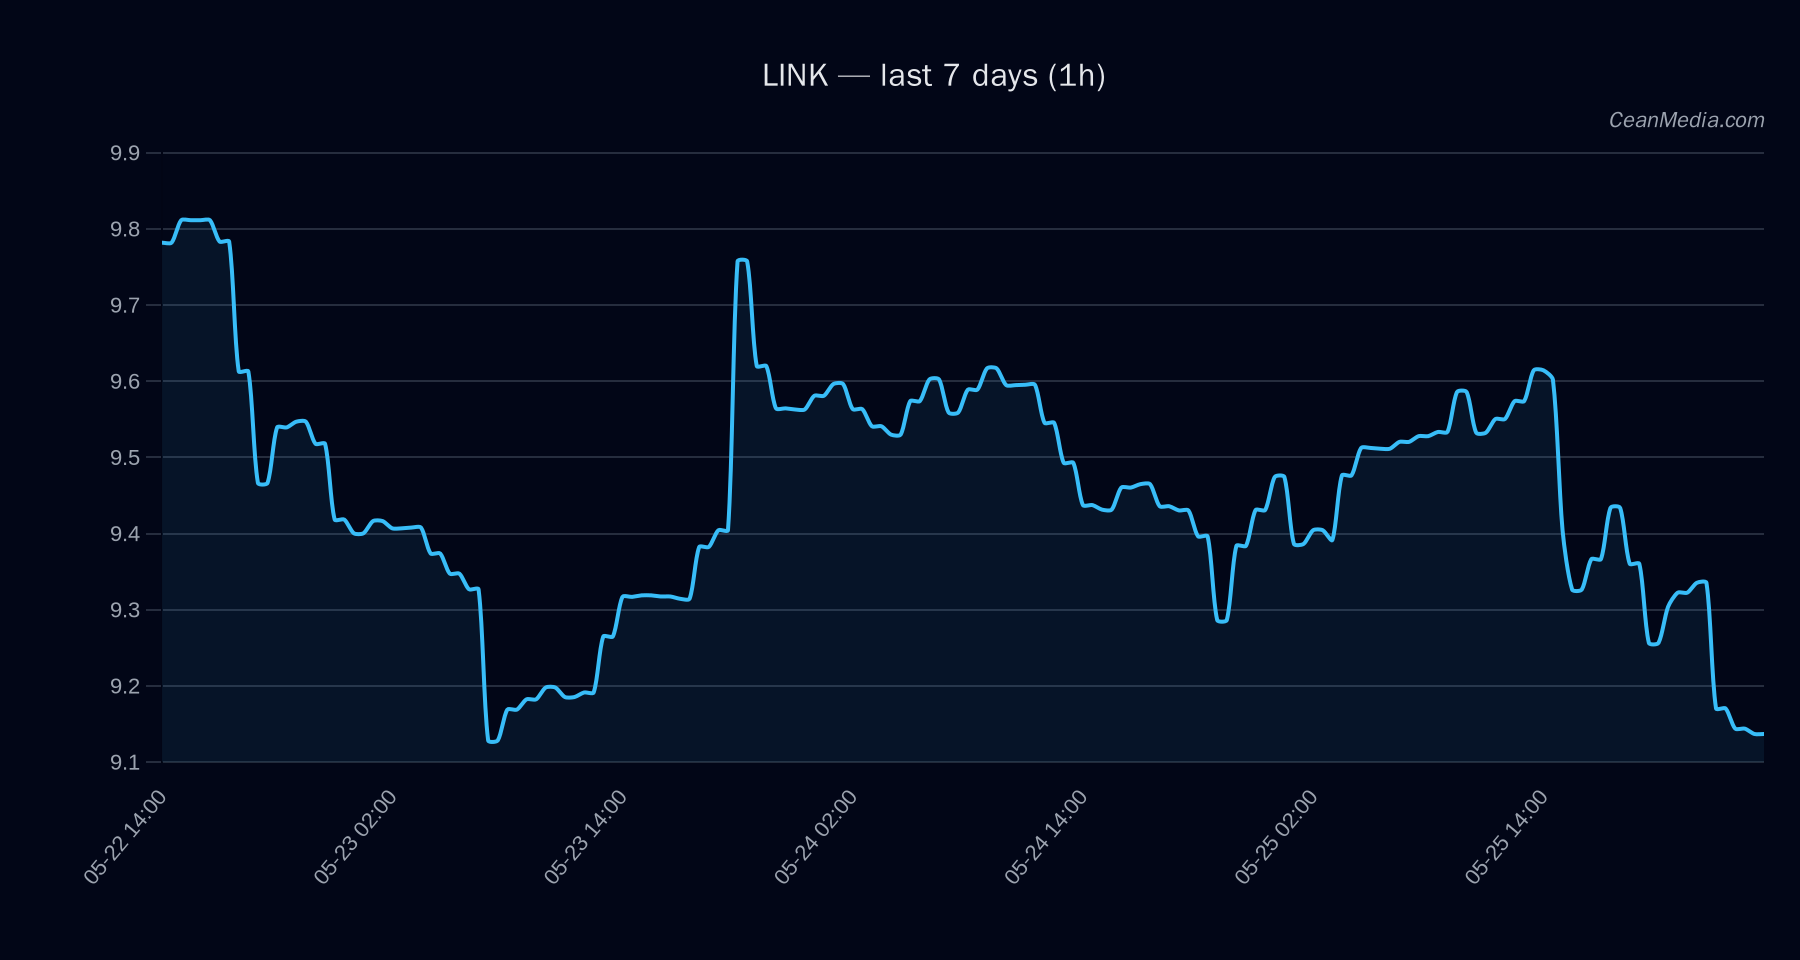
As of 2026-05-28, LINK sits in a tight trading range between 8.96 (support) and 9.32 (resistance). The price closed at 9.137, within the expected forecast band. Market context shows very low volatility with a 7-day implied volatility regime described as very low, and systemic risk indicators signaling cautious sentiment across risk assets. Bitcoin dominance remains elevated around 57.8%, suggesting a risk-off backdrop that may weigh on altcoins like LINK in the near term.
Technical Analysis: LINK
: 9.137 : EMA12 < EMA26, SMA50 < SMA200, RSI 32 : 8.4015 – 9.6394; Median (P50): 9.2749 : - Support near 8.96 (major 9.42)
- Resistance near 9.32 (major 10.1)
- Up break: 1h close > 9.32 → targets 9.5061 and 9.6925
- Down break: 1h close < 8.96 → targets 8.7752 and 8.5961
Drivers
: - LIQ TO OI EMA12: +1.9 contribution (value 5.64)
- NASDAQ100 RET 5D: -1.25 contribution (value 0.5)
- SP500 RET 5D: +1.17 contribution (value 0.38)
- LIQ TO OI Z-SCORE: -1.1 (value 4.42)
- STABLE MCAP LOG1P: -0.99 (value 0.74)
- RUSSELL2000 RET 5D: +0.66 (value 0.85)
: Very low volatility regime; breadth figures show limited participation above SMA50; BTC-Dominance around 57.8% with mild negative delta over 7 days, signaling risk-off pressure that can impact alts.
ETF Flows (BTC/ETH)
Contextual note: ETF flow data provided pertains only to BTC and ETH and should be considered as market backdrop, not a primary signal for LINK. The BTC ETF shows +$629.8M for 1D, +$198.4M for 5D, and +$585.2M for 10D; the ETH ETF shows +$101.2M for 1D, -$20.8M for 5D, and +$81.6M for 10D. Net positive flows into BTC/ETH can reflect risk-on appetite or hedging activity, but LINK-specific signals remain driven by its own technicals and alt-market dynamics.
What to Watch Next
- Watch for a close above 9.32 on a 1-hour basis to validate upside continuation toward 9.50–9.69.
- Monitor a break below 8.96 to confirm downside path toward 8.78–8.60.
- Observe changes in BTC dominance and overall risk-on/off sentiment as ETF flows evolve, to reassess altcoin risk exposure.
- Keep an eye on volatility regime; sustained volatility increases could widen the expected trading range.
Hashtags: #LINKanalysis #CryptoMarkets #TechnicalAnalysis #ETFFlows #BTC #ETH #MarketSnapshot #Alts #RiskOn #AltsTrading #Volatility #Momentum