Market Snapshot
As of the latest data, BNB sits in a mixed technical regime with bearish pressure but no decisive directional breakout. The model assigns a down bias with low certainty (26/100), and price is approaching a narrow trading range between defined support and resistance. Overall market context shows very low volatility and weak breadth, with external risk signals broadly tepid to negative.
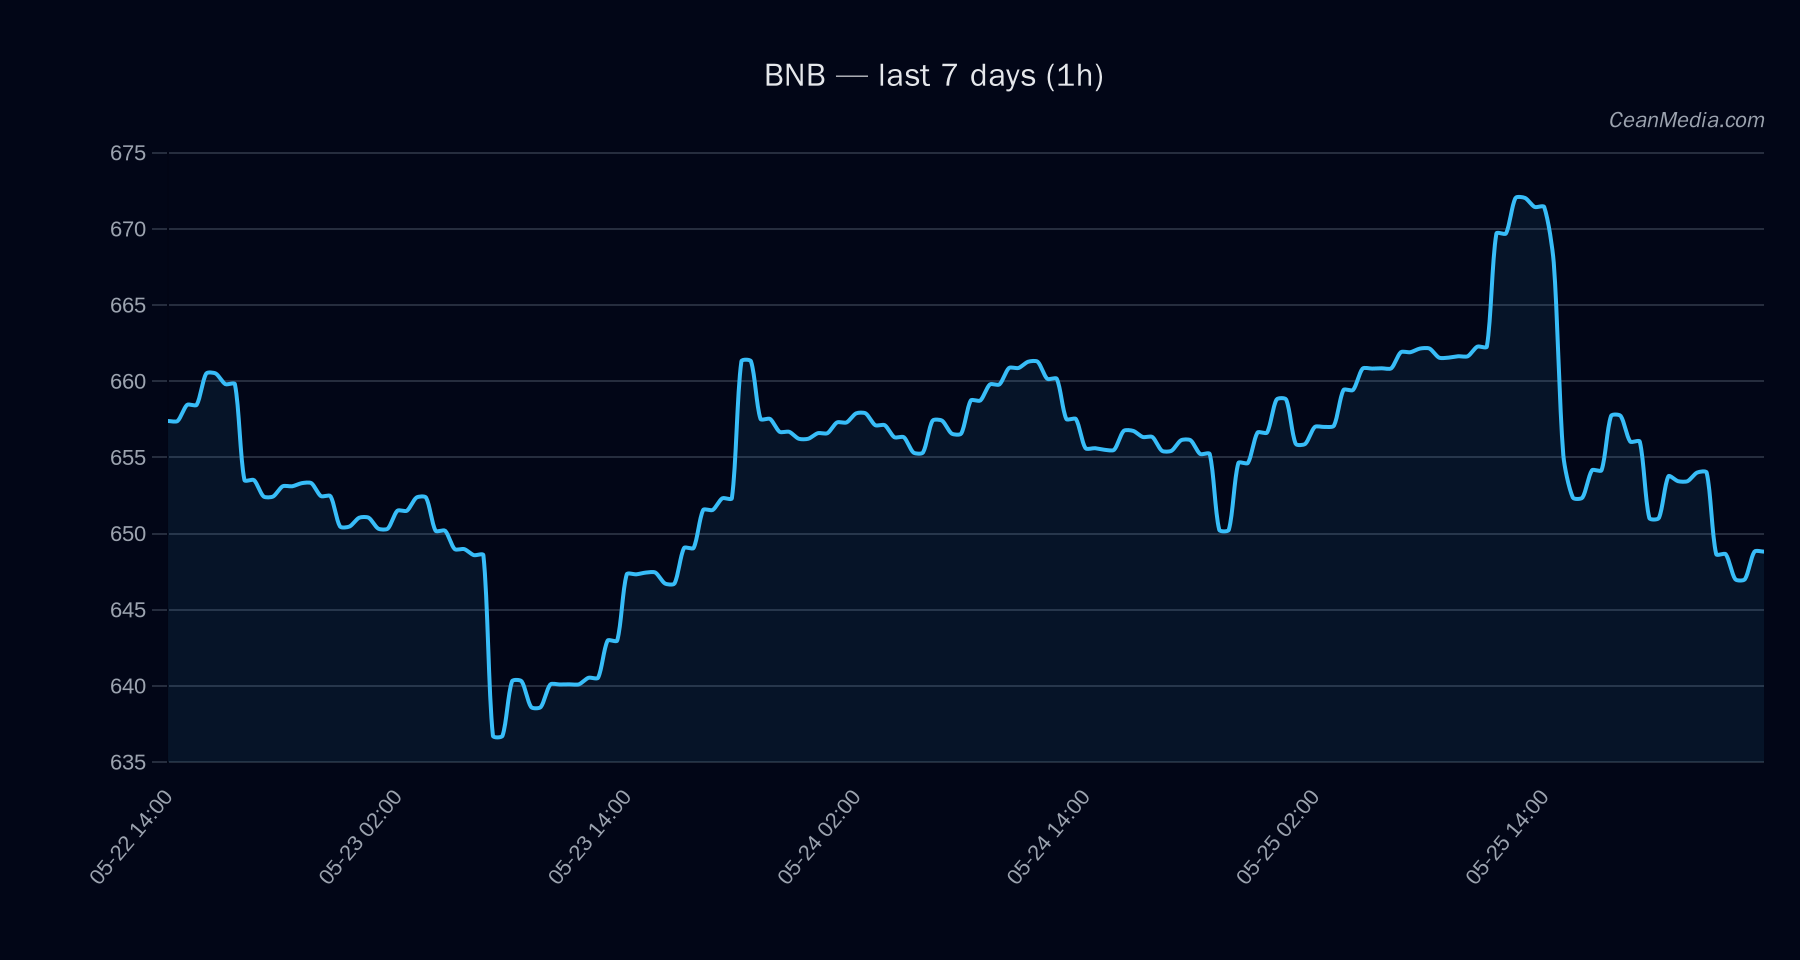
Price current: 648.82
Technical Analysis: BNB
: -2.7; two-way conflicts observed. : EMA12 < EMA26; SMA50 > SMA200 (bearish divergence between near-term and long-term moving averages). : Close at 648.82.
Forecast and Range
: 622.98 – 671.52; P50 at 645.13.
Levels
Trigers
- Up Trigger: 1h close > 662 → 675.03 / 688.27
- Down Trigger: 1h close < 636 → 623.13 / 610.41
Drivers
: EMA slope (-0.0012) contributing to downside bias; Funding Z-Score (0.71) supports cautious risk posture; BTC Dominance ~57.8% with minor 7d trend shift. : Cross-market risk assets softer; Stablecoin liquidity contracting; Sentiment in extreme fear (25). : Taker buy pressure (34.1%), long liquidations none indicated, positioning shows long crowdedness (1.65x).
ETF Flows (BTC/ETH)
Contextual note: ETF data is provided for BTC and ETH only and should be treated as context rather than a primary signal for BNB. The flows indicate risk-on or risk-off sentiment among larger crypto market instruments and can influence correlation dynamics in broader markets.
: 1D +$629.8M; 5D +$198.4M; 10D +$585.2M : 1D +$101.2M; 5D -$20.8M; 10D +$81.6M
What to Watch Next
- Watch for a close above 662 to validate potential upside targets around 675–688.
- Monitor 636 as an intra-range support; a break below this level could open a path toward 623 and 610.
- Keep an eye on volatility and breadth cues, as a shift in vol regime could precede a directional move.
- Note that BTC/ETH ETF flows indicate risk-on/off signals in the broader market but should not be used as the sole driver for BNB trades.
Hashtags: #BNBAnalysis #CryptoMarkets #TechnicalAnalysis #ETFFlows #BTC #ETH #MarketStrategy #PriceAction #CryptoRisk #Volatility #Indicators #TradingView
Summary
BNB faces a cautious environment with a sideways bias and limited momentum. Key levels provide clear decision points: a breakout above 662 could sustain a move toward mid- to high-670s, while a break below 636 invites a decline toward the 620s. ETF flow data for BTC/ETH supports a broader context of tepid risk appetite, reinforcing the need for confirmation before extrapolating direction from market signals alone.