Market Snapshot
On 2026-06-02, ADA trades around 0.226 with a mixed to bearish bias and low certainty. The model indicates a 68% probability of up movement within a 24-hour horizon, but a composite TA view remains bearish due to key indicators aligning on downside pressure. Market breadth remains thin, and volatility is very low, which can amplify sensitivity to short-term triggers. ETF flows provided for BTC and ETH offer external context but should not be treated as primary signals for ADA direction.
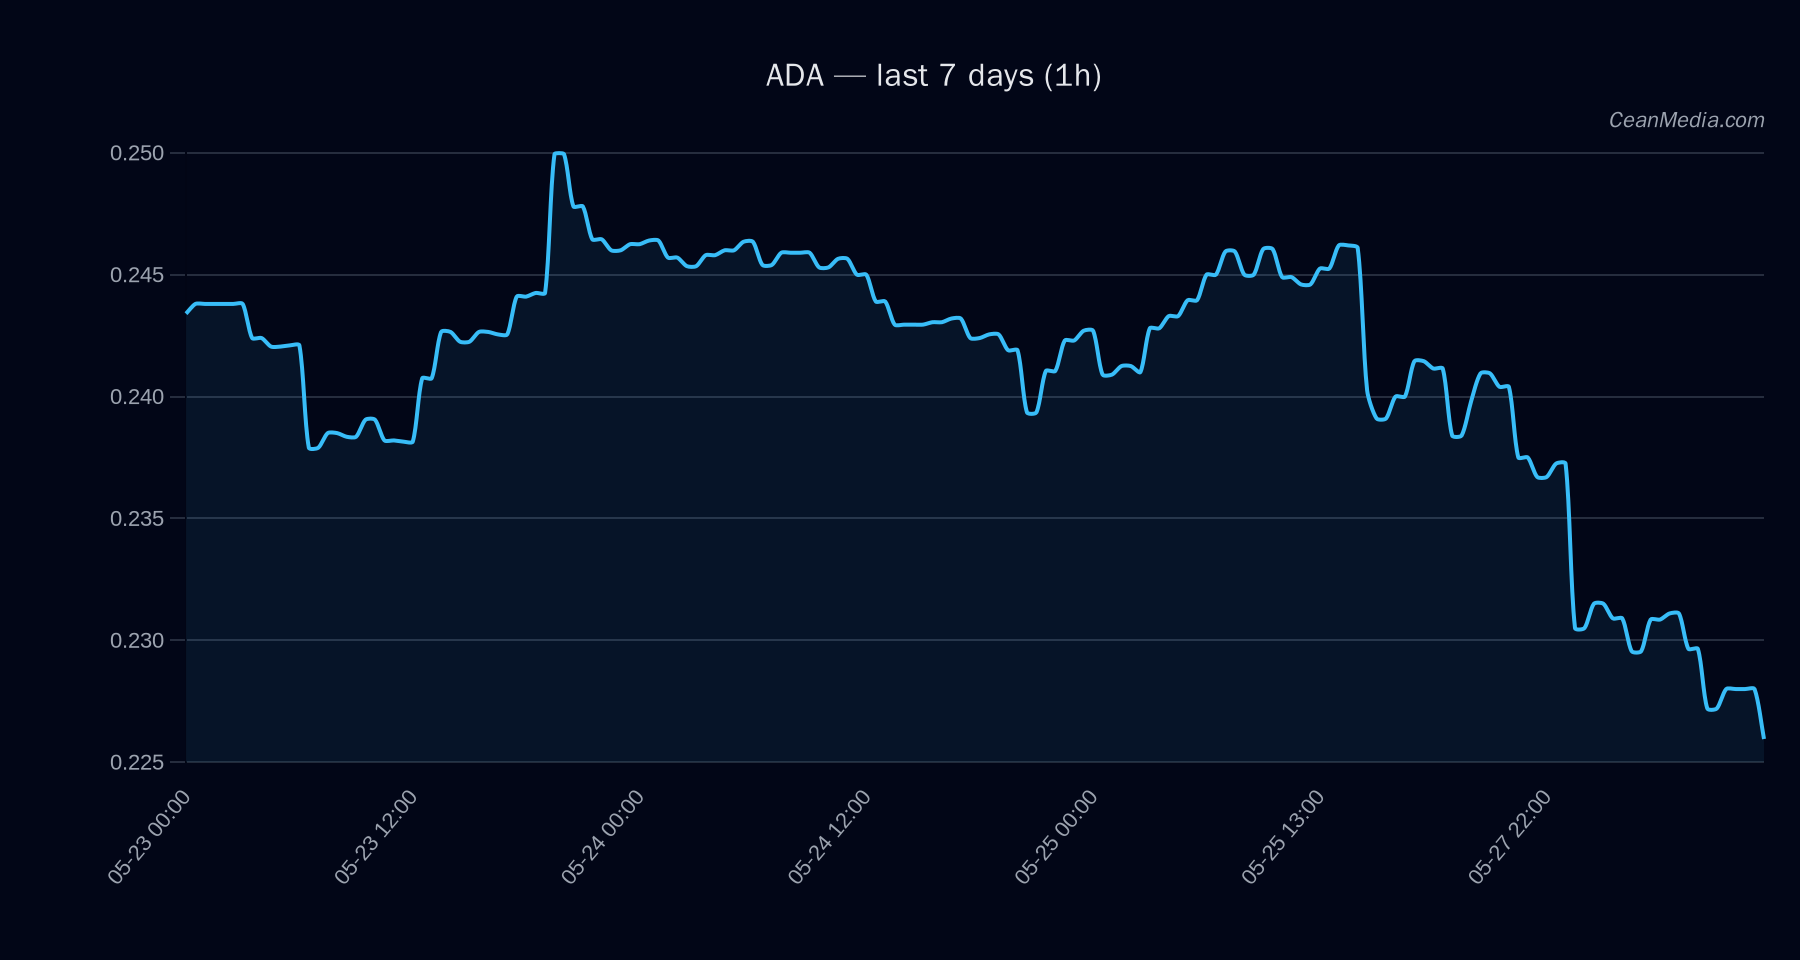
Technical Analysis: ADA
-3.9; TA alignment conflicts (3) bearish; RSI 27 EMA12 < EMA26; SMA50 < SMA200; RSI oversold; 24h volatility σ24h = 0.87%; Volatility regime: Very low Support near 0.22; major support near 0.24; Resistance near 0.23; major resistance near 0.25 0.2382; 20th-80th percentile: 0.2224 – 0.2545
Drivers
SPREAD BP (+4.37), SPREAD Z-SCORE (-1.11), RV 7D (+1.05), STABLE MCAP Z-SCORE (+1.01), VIX Z-SCORE (-0.81), NASDAQ100 RET 5D (+0.78) bearish TA signals with very low volume regime; RSI oversold at 27 cross-market risk assets softer; fear gauge at 23 (extreme fear)
ETF Flows (BTC/ETH)
The data indicate persistent ETF inflows for BTC and ETH over multiple horizons: BTC ETFs show +$629.8M (1D), +$198.4M (5D), +$585.2M (10D); ETH ETFs show +$101.2M (1D), -$20.8M (5D), +$81.6M (10D).
Interpretation: These flows reflect a risk-on backdrop and continued demand for large-cap crypto exposure. However, ETF data provided are BTC/ETH context and should not be treated as primary signals for ADA. ADA-specific moves may diverge from BTC/ETH while still being influenced by overall market liquidity and risk sentiment.
What to Watch Next
- Monitor 1-hour closes around 0.23 to assess potential breakout toward 0.2353–0.24 if triggered.
- Observe any move below 0.22 for potential acceleration toward 0.2172–0.2128 levels.
- Keep an eye on overall market breadth and volatility regime, given the very low vol environment.
- Track BTC/ETH ETF flow momentum as contextual risk-on/off signals, while prioritizing ADA-specific triggers.
Hashtags: #ADA #cryptomarket #technicalanalysis #ETFlux #BTC #ETH #riskon #riskoff #triggers #levels #trend #RSI