Market Snapshot
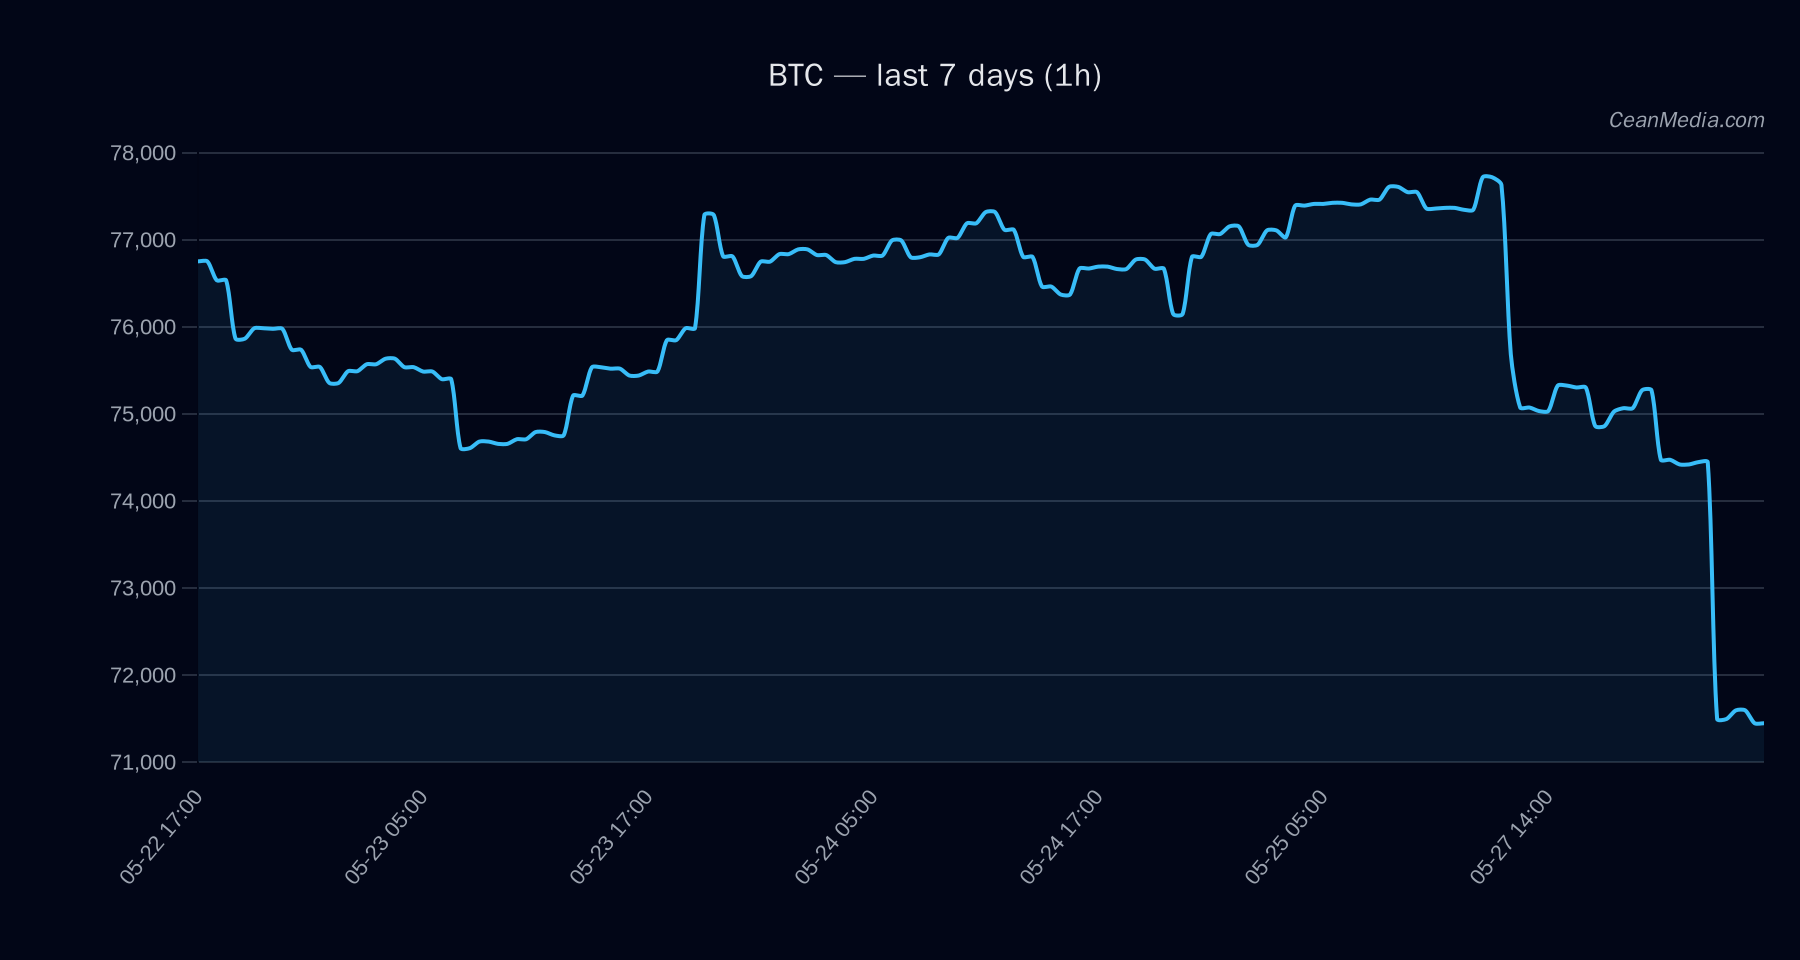
As of the latest assessment, BTC trades within a defined range with a bearish bias. The instrument sits between support near 69,675 and resistance around 72,525, with a forecast skews toward downside over the near term. The current price closes at 71,090.71, and volatility remains very low, contributing to limited breakout signals.
Technical Analysis: BTC
- bearish (certainty 40/100)
- -2.8
- bearish; RSI at 15, EMA12 < EMA26, SMA50 < SMA200, very low 24h volatility (σ24h ≈ 0.96%)
- Close 71,090.71
-
- Support: near 69,675
- Major Support: 76,125
- Resistance: near 72,525
- Major Resistance: 77,800
-
- Up: 1h close > 72,525 → 73,962.77 / 75,413.03
- Down: 1h close < 69,675 → 68,275.52 / 66,882.14
- P50 73,769.46; P20-P80 69,797.90 – 77,094.00
- Distance from MA, EMA slope, funding and basis z-scores, order-book imbalance
- Break above 72,525 will shift toward a more constructive setup; break below 69,675 confirms downside 68,275 / 66,882 targets
Drivers
-
- Distance from MA: -2.98 (contribution -1.57)
- LS Global Delta 24h: +5.46 (contribution -0.72)
- EMA slope: -0.0056
- Funding Z-score: +1.05
- Basis Z-score: +1.17
- Order-book imbalance (EMA5): -0.35
- Market context: Very low vol regime; breadth modestly positive over a short window (17% above SMA50); BTC.D around 56.6% with a negative 7-day delta
- Macro/Market Signals: Cross-market risk assets supported, stablecoin liquidity contracting; fear index around 29
ETF Flows (BTC/ETH)
Context note: ETF data here reflects BTC and ETH only and is provided as market context rather than a primary signal for BTC pricing. BTC ETFs show positive net flow recently, while ETH ETF flows are mixed. This information should be considered alongside price action and micro-structure signals.
- BTC ETF Flows: 1D +$629.8M; 5D +$198.4M; 10D +$585.2M
- ETH ETF Flows: 1D +$101.2M; 5D -$20.8M; 10D +$81.6M
What to Watch Next
- Watch for a close above 72,525 to reframe near-term bias toward neutral/bullish with potential targets toward 73,962 and 75,413 if momentum strengthens.
- Monitor a break below 69,675 for confirmation of the downside path toward 68,275 and 66,882, particularly given very low volatility conditions.
- Keep an eye on ETF flow momentum as a contextual risk-on/off signal, noting BTC ETF inflows remain robust while ETH flows are mixed.
- Observe breadth and cross-market signals for any dispersion that could precede a regime shift in volatility or trend strength.
Hashtags: #Bitcoin #BTC #CryptoMarkets #TechnicalAnalysis #ETFFlows #MarketSnapshot #TradingStrategy #Liquidity #Volatility #RiskManagement
Note: This report combines technical analysis with ETF flow context to provide a holistic view. ETF data is contextual and not the primary driver for BTC price alone.