Market Snapshot
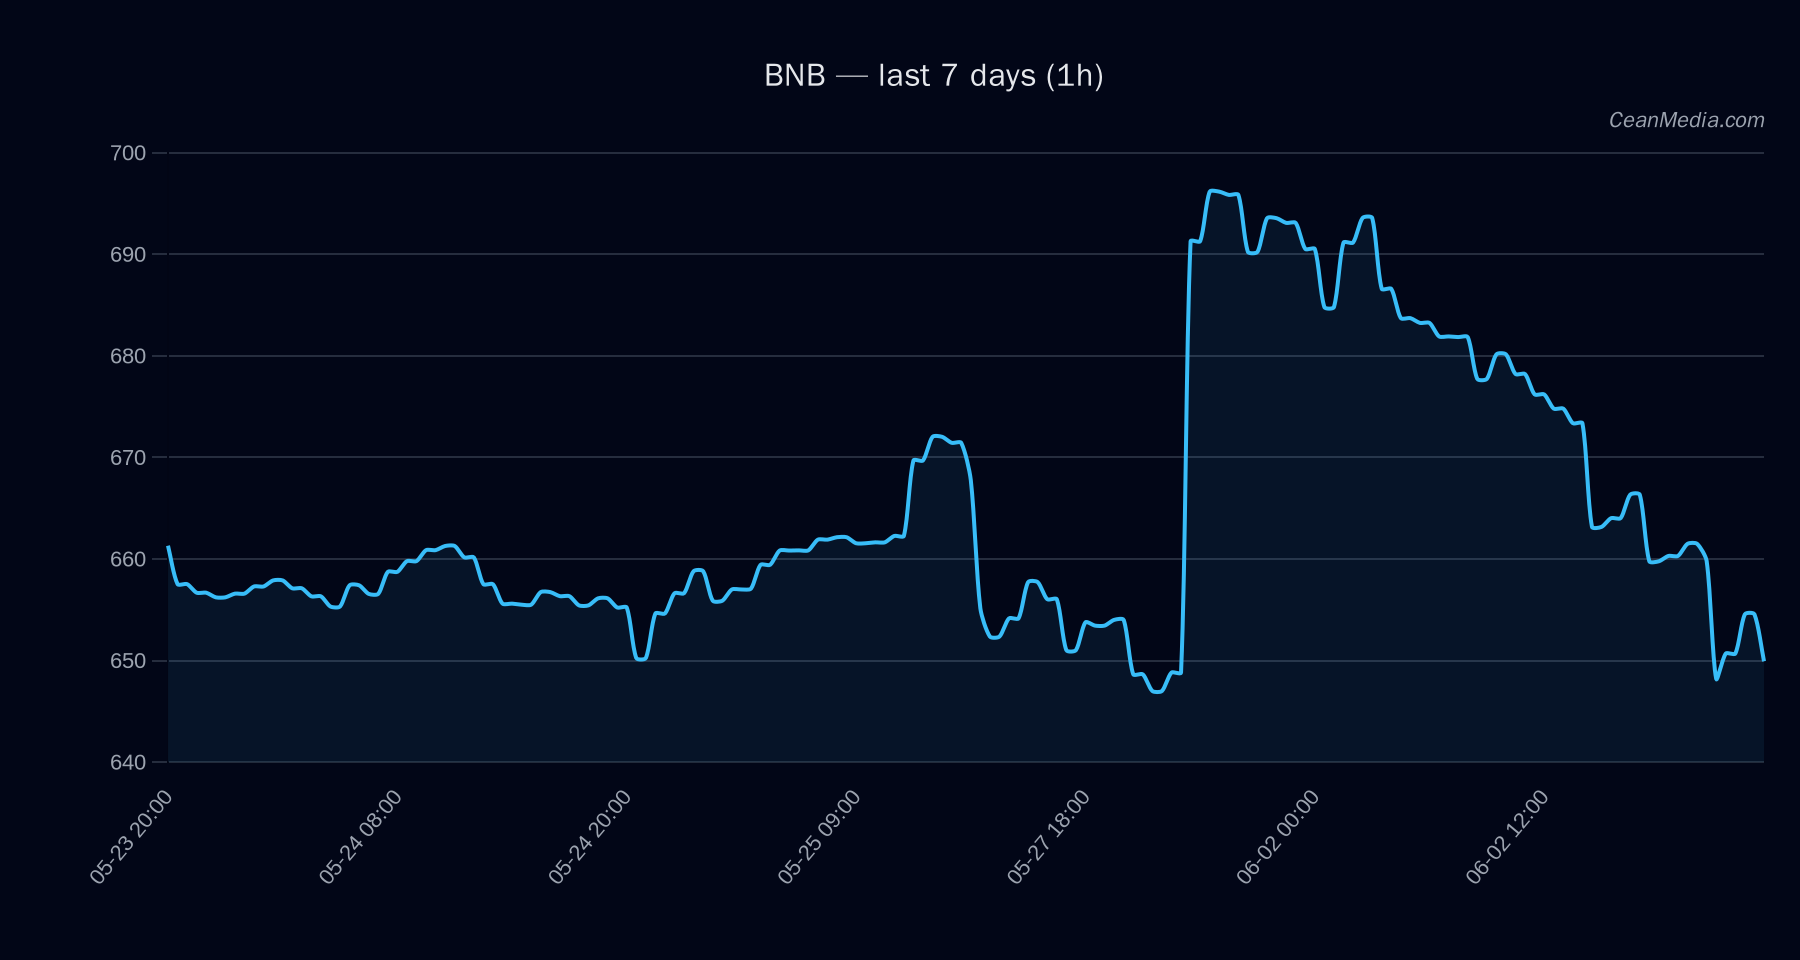
As of 2026-06-03, BNB sits between key technical levels with a bearish tilt in the short term. Price is near 648.79, with a forecast range suggesting potential downside risk while macro signals reflect broad risk-off sentiment. ETF flow data provided here relates to BTC and ETH and serves as market context rather than a primary signal for BNB trading decisions.
Technical Analysis: BNB
- Bias and Trend: Bearish bias with high certainty (77/100). TA trend described as sideways with RSI at 33.
- Key Indicators: EMA12 < EMA26, SMA50 > SMA200, RSI 33, 24h volatility sigma 0.63%, very low volatility regime.
- Current Price: 648.79
- Support and Resistance: Support near 636 (major 643), Resistance near 662 (major 680).
- Forecast Range (P50): 636.47, with P20-P80 range 607.63 – 691.29.
- Triggers: Up thesis requires 1h close > 662 (target 675.00–688.24). Down thesis requires 1h close < 636 (targets 623.10–610.38).
- Invalidation: Not explicitly stated; consolidation around the 636–662 range with no breakout confirmation indicates ongoing balance until a clear move occurs.
Drivers
FNG Z-SCORE (-3.91), SPREAD BP (+3.42), DEPTH USD 10BP LOG1P (-1.66), FNG VALUE (+1.20), BTC DOMINANCE Z-SCORE (-1.11), BTC DOMINANCE (+1.11). Very low vol regime; breadth 0% above SMA50; F&G indicator at extreme fear (F&G: 11). Cross-market risk assets softness and fear components align with the downside tilt for BNB in the near term.
ETF Flows (BTC/ETH)
ETF flow data provided covers BTC and ETH only. BTC ETFs show +$629.8M (1D), +$198.4M (5D), +$585.2M (10D); ETH ETFs show +$101.2M (1D), -$20.8M (5D), +$81.6M (10D). These figures indicate ongoing demand for BTC/ETH futures-based exposure and can reflect broader risk-on/risk-off dynamics in crypto markets. It is important to note that ETF data is context and not a primary signal for BNB trading decisions.
What to Watch Next
- Monitor 1h price close relative to 662 resistance and 636 support for potential breakout or breakdown triggers.
- Watch for changes in RSI and volatility regime as volatility remains very low; a shift could precede a more pronounced move.
- Assess cross-market risk sentiment and BTC/ETH ETF flow momentum for corroboration, while maintaining focus on BNB-specific triggers.
- Observe any changes in BTC dominance signals and FNG/SPREAD dynamics for potential spillover effects on BNB.
Hashtags: #BNB #CryptoTrading #TechnicalAnalysis #ETFFlows #BTC #ETH #MarketLens #RiskManagement #CryptoMarkets #PriceAction
Hashtags: #BNB #TechnicalAnalysis #MarketContext #ETFFlows #CryptoOutlook #PriceLevels