Market Snapshot
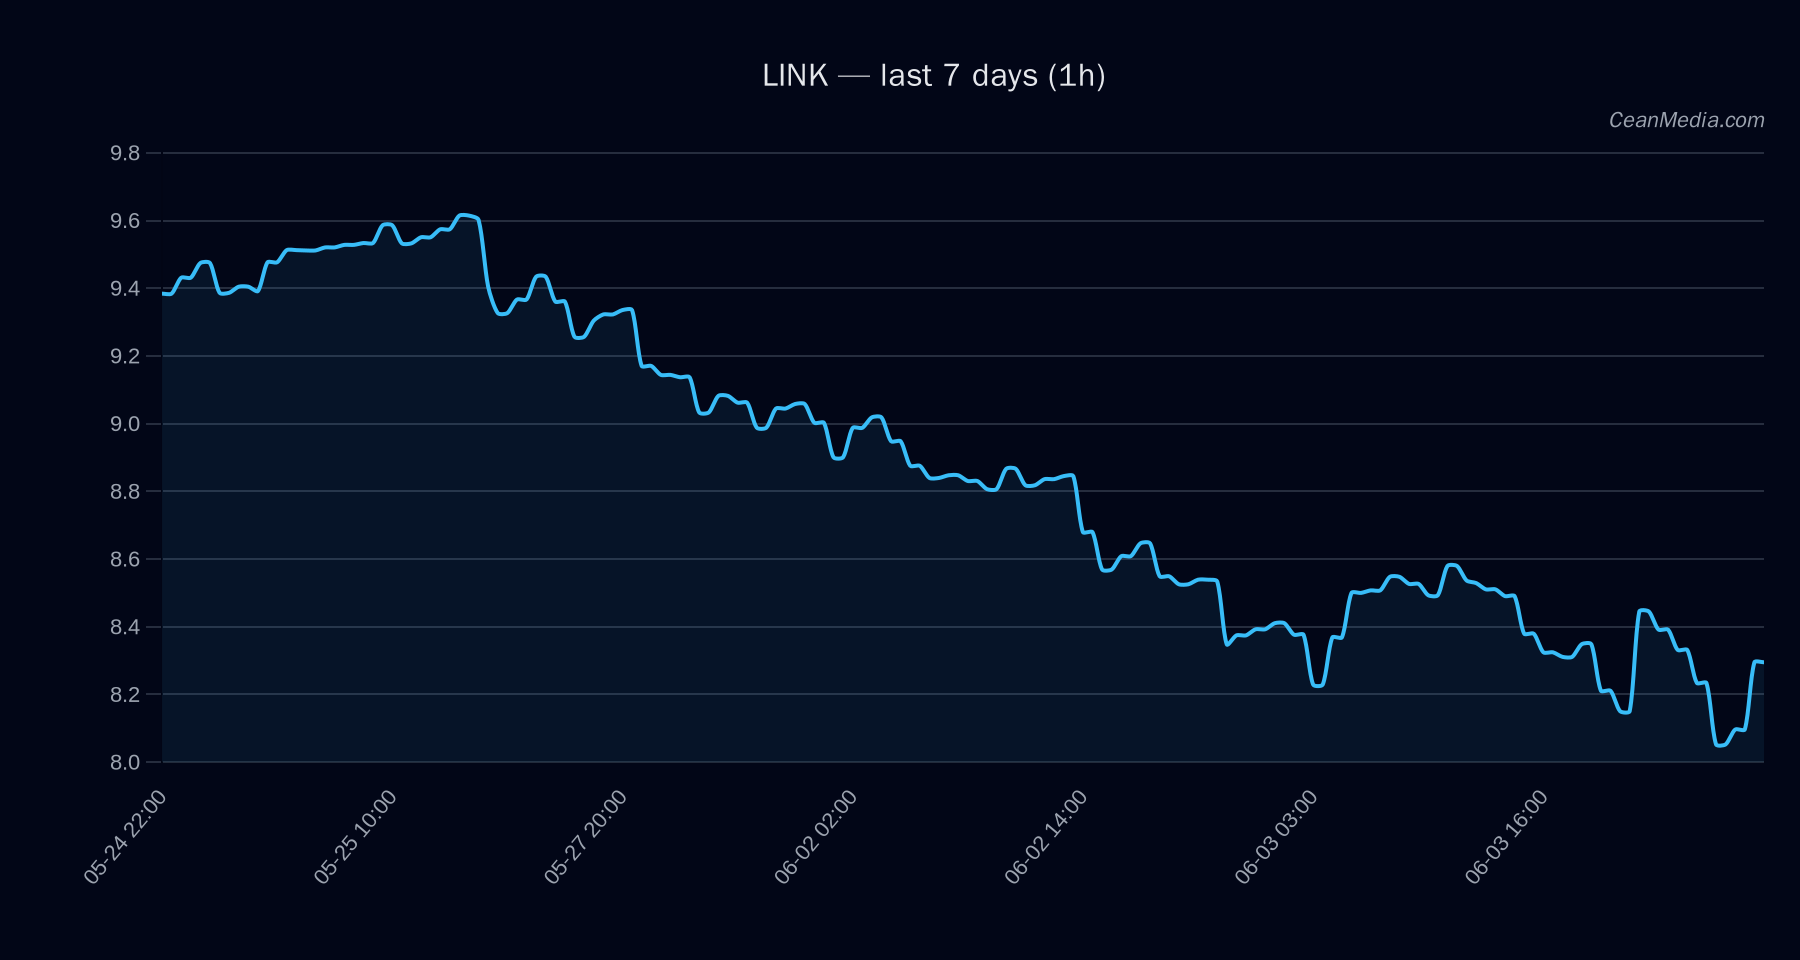
As of the latest reading, LINK trades near the 8.21 area with a defined support around 8.04 and a resistance near 8.38. The model signals a sideways to bearish bias, with a 24-hour volatility regime described as low and a price action cadence suggesting limited breakout potential in the immediate term.
Technical Analysis: LINK
- Bias: bearish (certainty 62/100).
- Price: Close 8.212; forecast range P50 8.3406, with potential moves between 7.3815 and 9.1617 (P20-P80).
- Trend indicators: EMA12 < EMA26; SMA50 < SMA200; RSI 42; volatility (σ24h) 1.21%; volume regime: Low.
- Levels: Support near 8.04 (major near 8.82); Resistance near 8.38 (major near 9.58).
- Traders’ triggers: Break above 8.38 targets 8.5438 / 8.7113; Break below 8.04 targets 7.8868 / 7.7258.
- Forecast: sideways (5% probability next 24h); model suggests a bearish TA view despite a static price range.
- Context: Breadth remains muted; BTC price correlation stands at ~0.79 over 72h, indicating macro-market moves, particularly BTC, can influence LINK in the near term.
Drivers
ETF flow resilience noted in BTC/ETH, BTC dominance metrics, and stablecoin liquidity signals. Upward skew via funding and basis metrics is limited; RSI remains in the neutral-to-bearish zone. Cross-market risk assets have shown soft dynamics; sentiment remains in a fear regime (F&G = 12). Long crowding with short-term squeeze pressure indicated, yet overall liquidity signals show modest activity in the near term.
ETF Flows (BTC/ETH)
Context: ETF flow data is provided for BTC and ETH only and should be treated as contextual information rather than a primary signal for LINK. The data indicate positive demand for BTC and ETH ETFs over 1D, 5D, and 10D horizons, which can reflect broader risk-on appetite or institutional interest in leading assets during this period.
- BTC ETF: 1D +$629.8M; 5D +$198.4M; 10D +$585.2M
- ETH ETF: 1D +$101.2M; 5D -$20.8M; 10D +$81.6M
What to Watch Next
- Watch for a close above 8.38 to validate a potential near-term upside continuation toward 8.54–8.71.
- A break below 8.04 would open downside targets toward 7.89 and 7.73.
- Monitor BTC dominance and ETF flow shifts as potential macro drivers for LINK liquidity and risk sentiment.
- Observe changes in volatility regime and break-even levels, which may reframe the risk/reward for intraday trades.
Hashtags: #LINK #CryptoAnalysis #MarketSnapshot #TechnicalAnalysis #ETFFlows #BTC #ETH #MarketContext #RiskOn #Liquidity #TradingStrategy #CryptoOutlook