Market Snapshot
Date: 2026-06-05 | Primary Asset: BTC
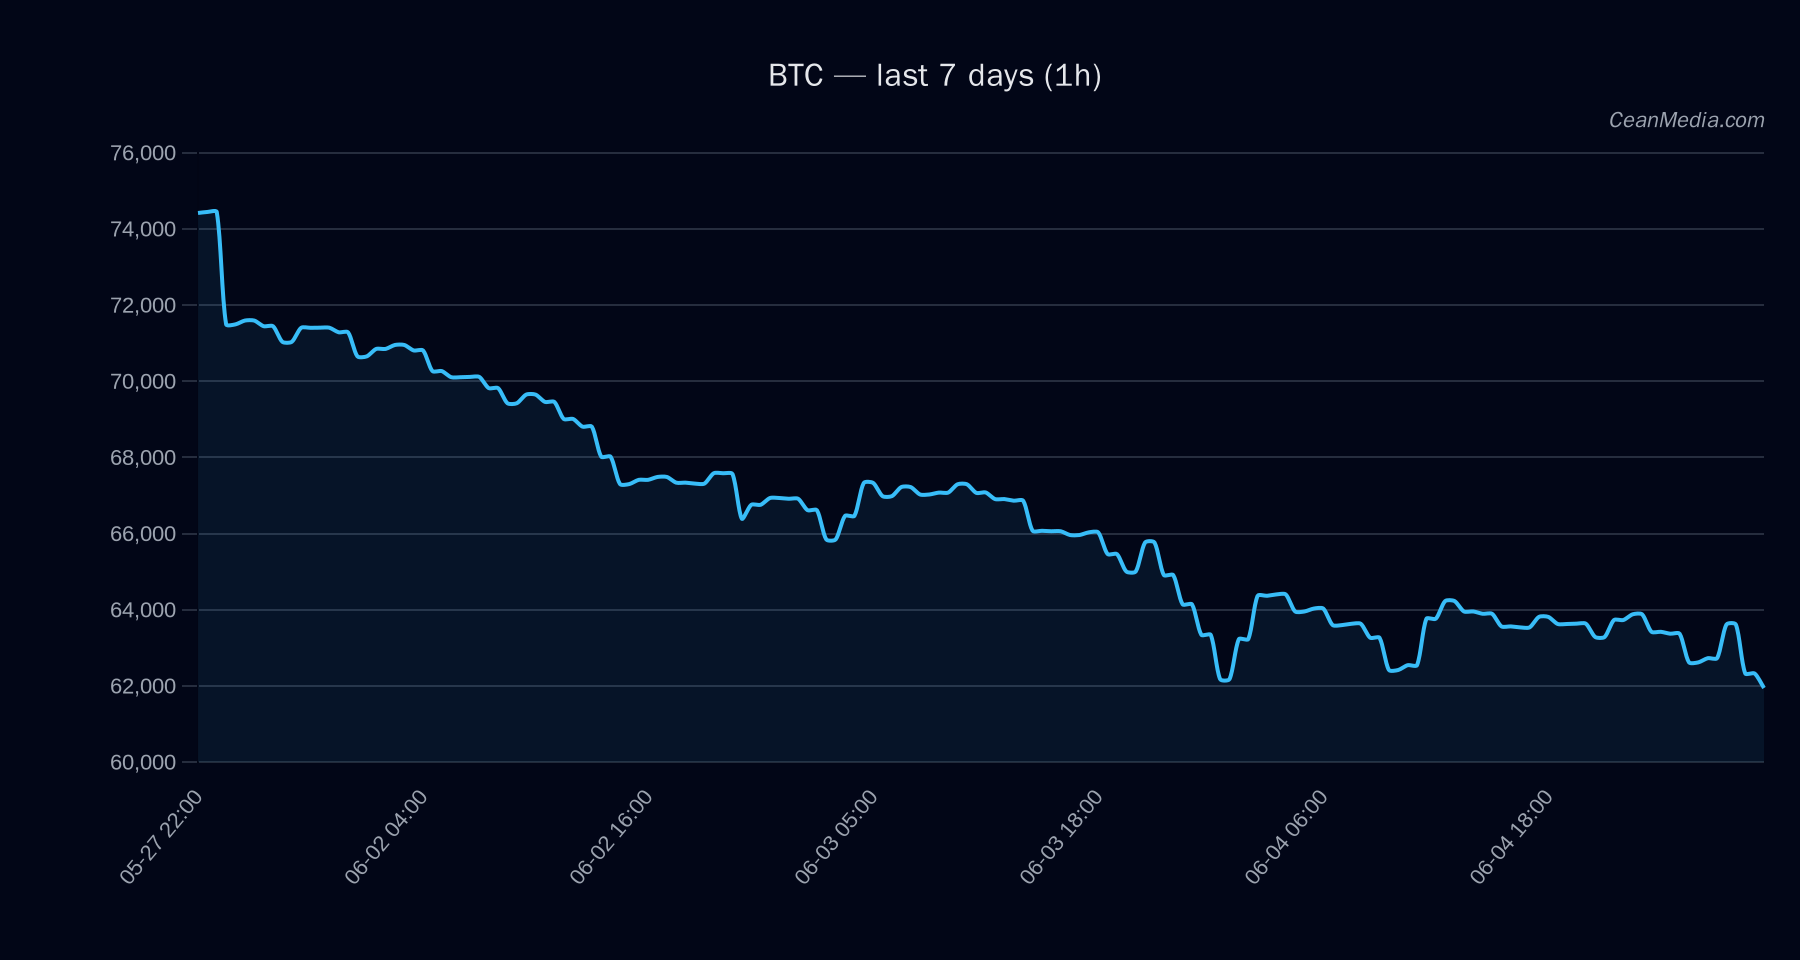
Close price: 61,534.33 USD. Market context shows very low volatility with a broad risk-off stance reflected in cross-market data and fear sentiment indicators. BTC.D around 56.0% with a modest daily change, while ETF flows for BTC/ETH point to ongoing inflows that may influence near-term liquidity and positioning.
Technical Analysis: BTC
- High (76/100)
- Composite score: -5.3
- Price: 61,534.33
Trend and momentum
- TA trend: Bearish
- RSI: 34 (neutral to oversold territory)
- Moving averages: EMA12 < EMA26; SMA50 < SMA200
- Volatility regime: Very low; σ24h ≈ 0.86%
Forecast and levels
- Forecast range (P50): 60,021.51
- Forecast band (P20-P80): 53,347.88 – 67,758.16
Key levels
- Support: near 60,300; major at 66,075
- Resistance: near 62,775; major at 67,725
Triggers
- Up: 1h close > 62,775 → 64,020.32 / 65,275.62
- Down: 1h close < 60,300 → 59,097.57 / 57,891.50
Invalidation
- Break above 66,075 on a sustained close would weaken the current bearish bias.
- Price holding above 60,300 without a confirmed breakout above 62,775 would keep the outlook cautious.
Contextual drivers
- Top drivers include EMA slope, funding and basis Z-scores, and order-book imbalance (EMA5).
- BTC dominance remains elevated with a value around 55.99% and modest 24h change.
- Market breadth is weak, and 72h correlation to BTC remains high (ρ ≈ 1.00), suggesting local moves are price-driven rather than broad-market rallies.
Drivers
- Return 24h: -0.03%
- EMA slope: -0.0031
- Funding Z-score: -1.14
- Basis Z-score: 0.33
- Order-book imbalance (EMA5): 0.29
- BTC return 24h: -0.03%
- Momentum/volatility
- Vol regime: Very low
- Trend strength: Moderate
- Macro/market context
- Cross-market risk assets are soft
- Fear/Sentiment: Extreme fear (F&G: 12)
- BTC.D indicates rising share of market capitalization held by BTC
ETF Flows (BTC/ETH)
Note: ETF data in this section covers BTC and ETH ETFs only. It provides market context and potential liquidity/near-term positioning signals but is not the primary signal for BTC price actions. Current data shows ongoing inflows into BTC ETFs with notable momentum over 1D and multi-day windows, alongside ETH ETF inflows.
1D +$629.8M | 5D +$198.4M | 10D +$585.2M 1D +$101.2M | 5D -$20.8M | 10D +$81.6M
Interpretation
- Net inflows indicate growing institutional interest and liquidity provision, which can support price stability in dips but do not contradict the current bearish bias for BTC in the near term.
- ETF flows should be considered as ambient market context rather than a primary trading signal for BTC direction.
What to Watch Next
- Watch for a close above 62,775 to challenge the 64,020–65,276 range on a confirmed bullish breakout.
- Monitor 60,300 as a near-term support; a break below could accelerate moves toward 59,097 and 57,891.
- Keep an eye on ETF flow momentum, particularly BTC ETF inflows, for potential liquidity-driven price reactions.
- Observe changes in volatility regime and cross-market risk appetite, which may alter the current bearish tilt.
Hashtags: #BTC #Bitcoin #crypto #trading #markets #ETFflows #riskmanagement #technicalanalysis #priceaction #liquidity #institutionalinvestors