Market Snapshot
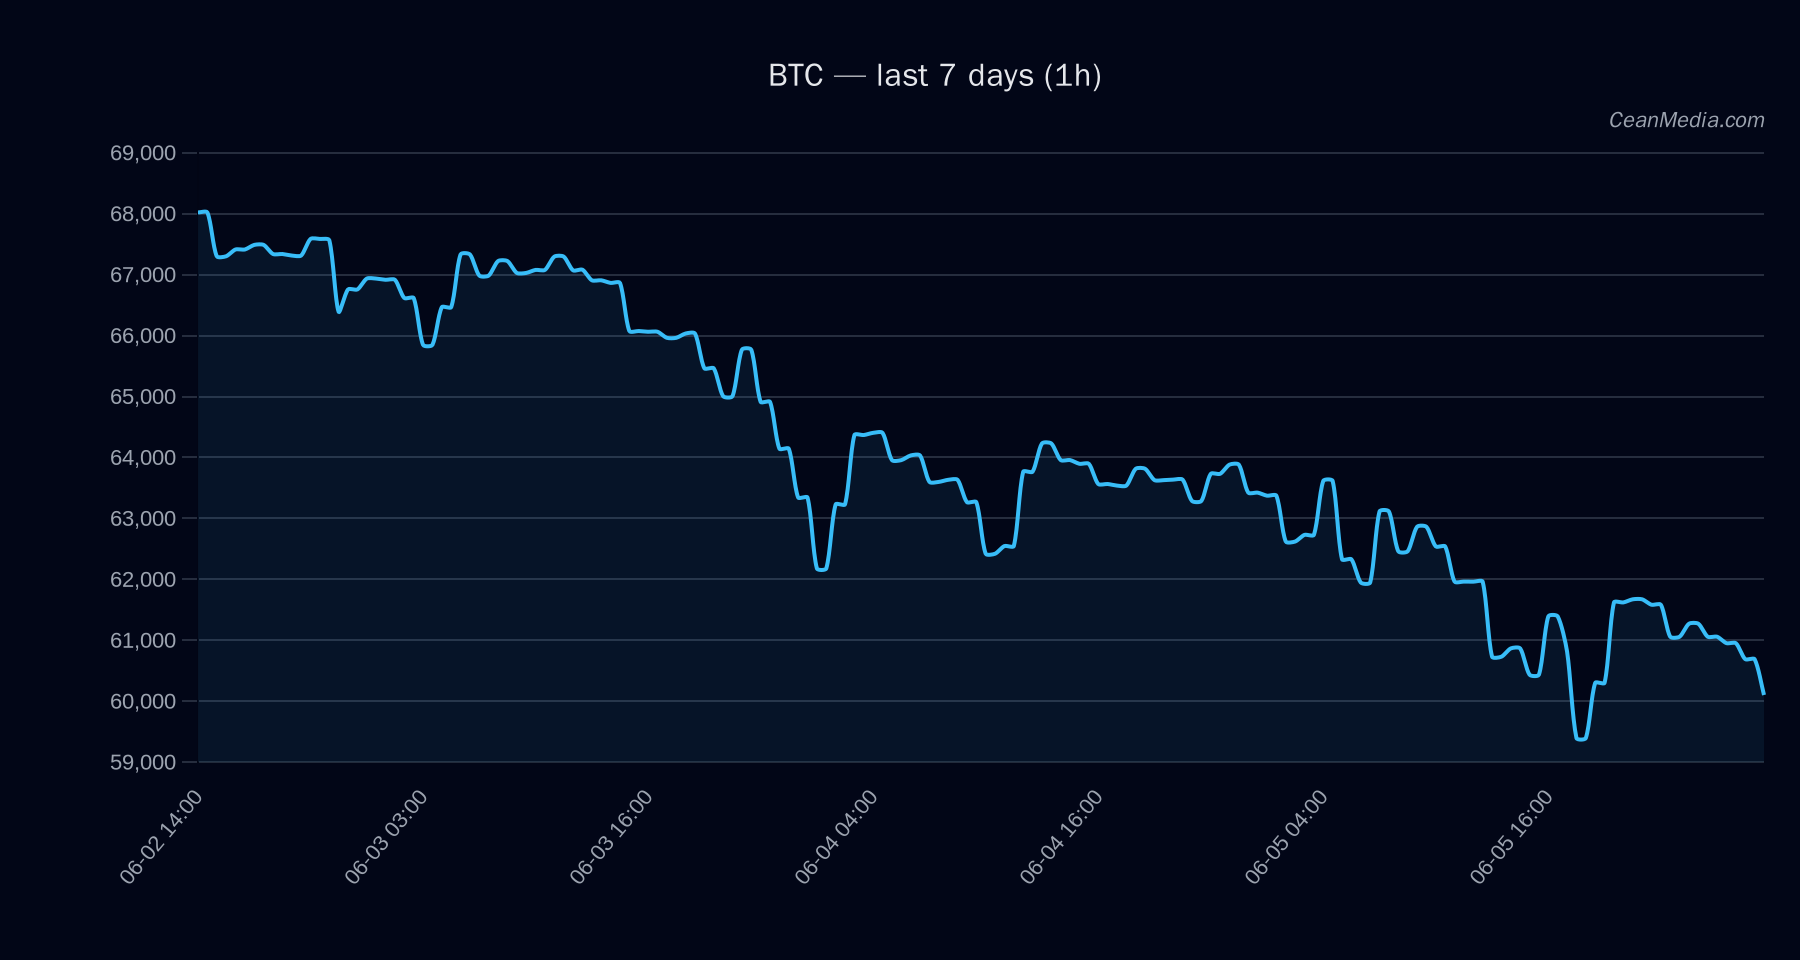
Bitcoin (BTC) remained range-bound with a bearish tilt as of 2026-06-06. The price closed near 60,923, trading within a defined range between support around 59,700 and resistance near 62,150. Overall market context shows low volatility and weak breadth, with extreme fear indicated by sentiment gauges. ETF flow data for BTC and ETH suggests continued institutional interest, but should be viewed as contextual rather than a primary signal for BTC direction.
Technical Analysis: BTC
EMA12 < EMA26; SMA50 < SMA200; σ24h = 1.15%; Vol Regime: Low 58,660.10;
P20-P80: 50,588.76 – 64,313.06- Resistance: Near 62,150; Major: 68,750
- Trigonometric Triggers:
- Up Trigger: 1h close > 62,150 → 63,384.13 – 64,626.96
- Down Invalidation/Trigger: 1h close < 59,700 → 58,510.31 – 57,316.22
Downward bias supported by EMA/MA alignment and low volatility; momentum indicators reflect cautious positioning.
Drivers
NASDAQ100 RET 1D, Stable MCAP Z-Score, Stock Basket 5D, Distance from MA, BTC Dominance Z-Score, FNG Value Model forecast favors downside (52%); TA signals bearish with RSI not oversold Vol regime is Low; Breadth shows limited participation beyond the 50-hour mark Risk assets have softened; overall sentiment reflects extreme fear
ETF Flows (BTC/ETH)
ETF data shown here covers BTC and ETH only and provides context for institutional activity rather than a primary BTC signal. BTC ETF flows show ongoing net inflows in the short term, while ETH inflows are positive but smaller in magnitude. This information should be interpreted as background risk appetite and potential liquidity shifts rather than a timing mechanism for BTC trades.
+$629.8M +$198.4M +$585.2M +$101.2M -$20.8M +$81.6M
What to Watch Next
- Watch for a close above 62,150 on a sustained basis to confirm upside potential toward 63,384 and 64,627.
- A break below 59,700 increases risk toward 58,510 and 57,316 in the near term.
- Monitor ETF flow momentum for BTC/ETH as a contextual signal about risk appetite, not as a primary BTC trigger.
- Keep an eye on volatility and breadth shifts, as a pickup could precede larger moves.
Hashtags: #BTC #Bitcoin #MarketAnalysis #CryptoTrading #ETFFlows #CryptoNews #TechnicalAnalysis #TradingStrategy #RiskManagement #MarketContext #Liquidity #Institutions