Market Snapshot
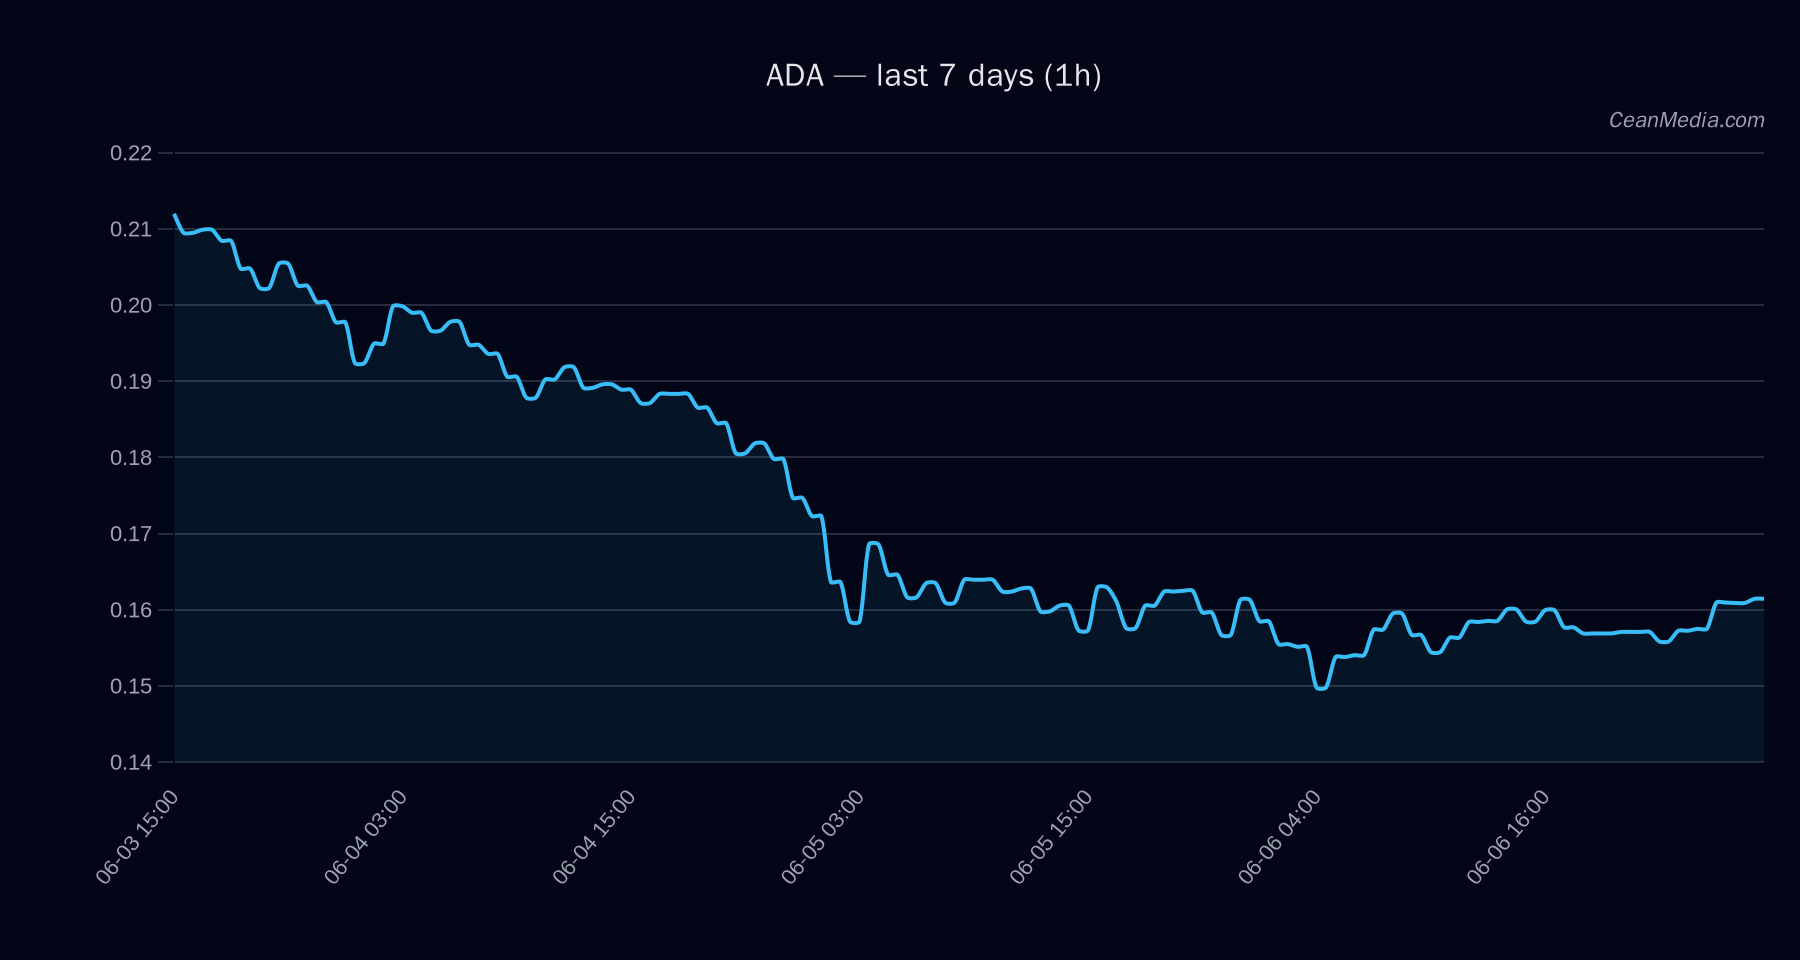
On 2026-06-07, Cardano (ADA) trades around the 0.161-0.164 USD area with a bearish bias in the near term. The composite model score is -5.6 with high certainty (80/100). Price action remains within a defined range ahead of potential trigger levels. Market breadth is favorable (>50h), BTC correlation stands at ~0.71, and the broader risk environment reflects extreme fear sentiment.
Technical Analysis: ADA
- : Bearish (high certainty 80/100)
- : Close ~0.1617 USD
- : Sideways; RSI 56
- : EMA12 < EMA26, SMA50 < SMA200, Volatility regime: Low (σ24h ~1.36%), ATR ~0.0011
- : P50 ~0.1598; P20-P80 ~0.1364–0.1677
- : Support near 0.16 (major 0.155); Resistance near 0.165 (major 0.18)
- :
- Up: 1h close > 0.165 → targets 0.1682 and 0.1715
- Down: 1h close < 0.16 → targets 0.1553 and 0.1521
- : Breakout confirmations required; current stance is inside range without breakout confirmation
Drivers
- Top model drivers indicate negative momentum for ADA with a composite model contribution of -2.4 and TA contribution of -1.0 (sideways, RSI 56, low vol).
- Market macro/flow: Cross-market risk assets are soft, sentiment is in extreme fear (12).
- BTC dominance Z-score and RV 7D contribute to risk-off dynamics; overall flow shows balanced taker activity with long positions relatively crowded.
- Read indicates ADA currently sits between support and resistance with a down-outlook bias; 83% probability of downside per the forecast.
ETF Flows (BTC/ETH)
Context: ETF flow data provided here is limited to BTC and ETH ETFs and should be interpreted as macro liquidity and risk sentiment context rather than a primary signal for ADA pricing.
- BTC ETF: +$629.8M (1D), +$198.4M (5D), +$585.2M (10D)
- ETH ETF: +$101.2M (1D), -$20.8M (5D), +$81.6M (10D)
The overall ETF flow indicates current risk-on appetite for BTC/ETH collateralized exposure, yet this does not directly imply ADA strength. In a broader context, ETF inflows to top-cap assets can accompany risk-on periods, but ADA’s local technicals and market microstructure remain the primary drivers for ADA trades.
What to Watch Next
- Monitor for a close above 0.165 on a 1-hour basis to validate a pullback to the 0.1682–0.1715 range.
- Observe a break below 0.16, which would target 0.1553–0.1521.
- Watch for changes in market sentiment indicators (F&G, BTC dominance) that could shift the risk-off/risk-on tilt.
- Keep an eye on BTC/ETH ETF flow momentum as a broader liquidity signal for risk assets, even though ADA-specific trades rely on intra-asset signals.
Hashtags: #ADA #Cardano #CryptoAnalysis #TechnicalAnalysis #MarketUpdate #BTCFlows #ETHFlows #ETFFlows #CryptoMarkets #RiskOnOff #TradingViews #CryptoNews