Market Snapshot
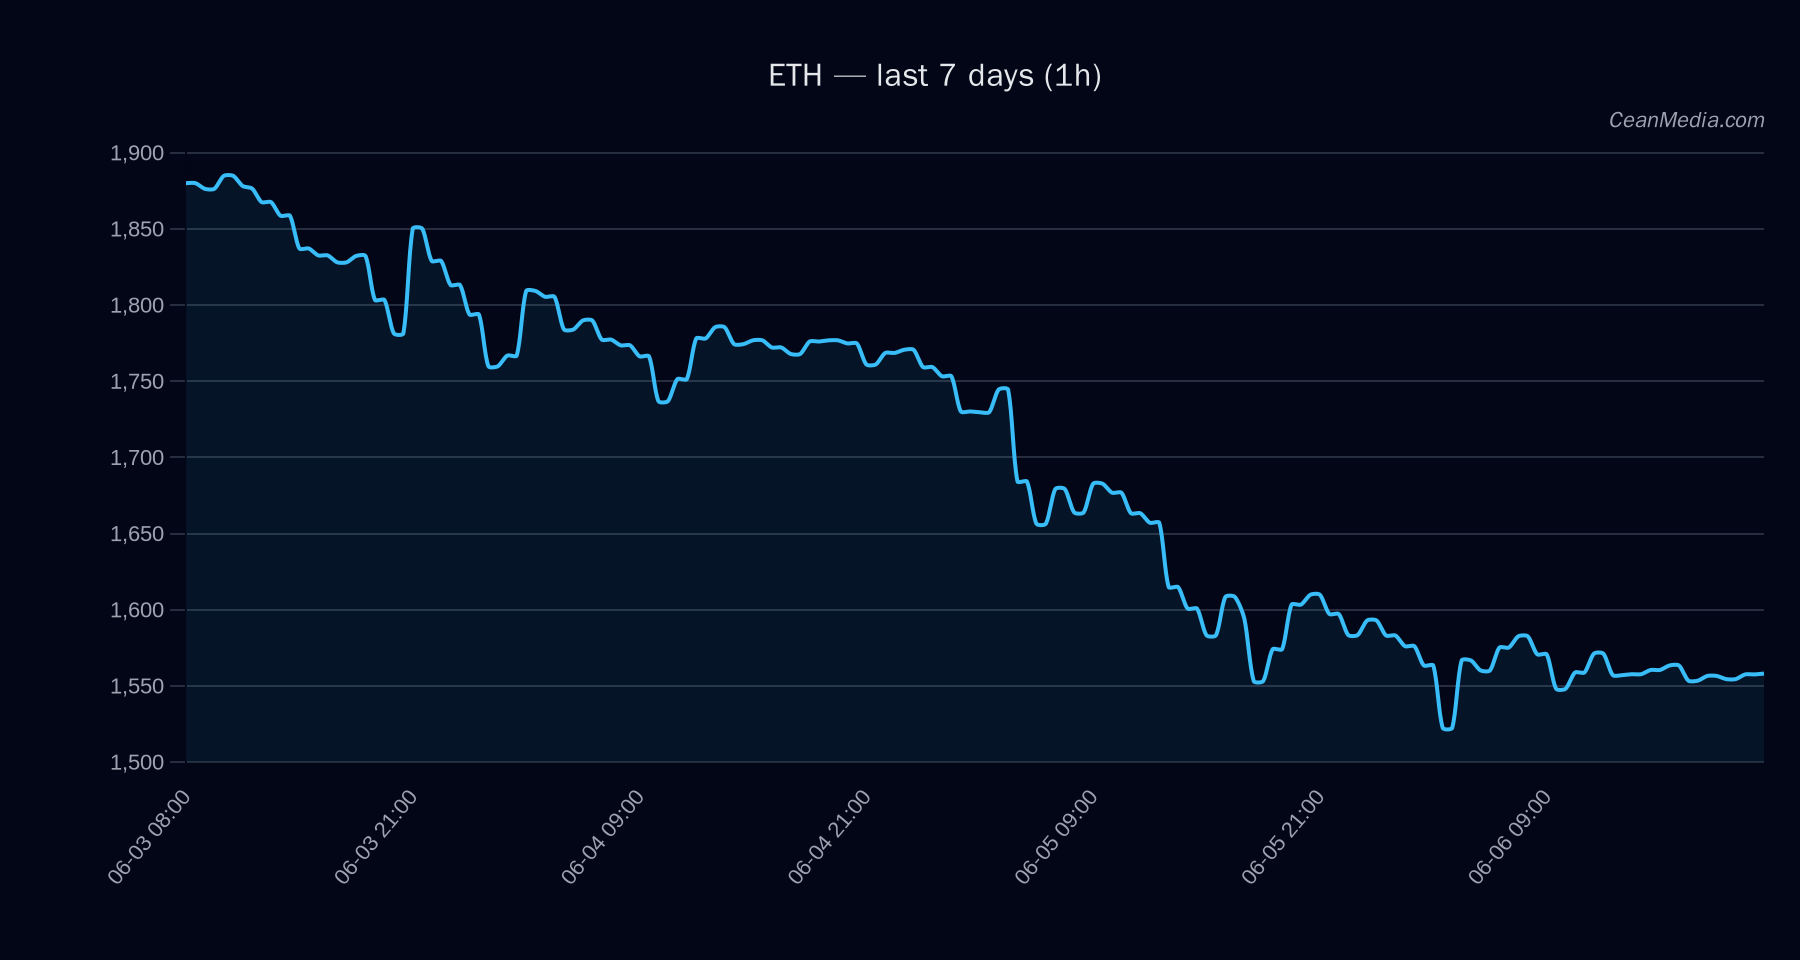
As of 2026-06-06, ETH traded around the 1,556 area with a bearish bias and high certainty. The model indicates a down path with a 58% probability, supported by technical signals and macro context showing risk assets under pressure and extreme market fear indicators. The next notable levels are a near-term support just above 1,524 and resistance near 1,588, with a major resistance around 1,668 and major support near 1,680 session highs. The current vol regime is low, with a relatively tight ATR indicating subdued intraday movement but ongoing downward pressure implied by the model and indicators.
Technical Analysis: ETH
- Bias: Bearish (certainty 91/100)
- Price: Close 1,556.05
- Trend indicators: EMA12 < EMA26; SMA50 < SMA200; RSI 42; volatility (σ24h) 1.01%; Volatility regime: Low
- Forecast: Down (58%), with Up 31% and Side 11%
- Levels: Support near 1,524 (major 1,524) | Resistance near 1,588 (major 1,588). Major resistance 1,668; Major support 1,680.
- Triggers:
- Up: 1h close > 1,588 → targets 1,618.91–1,650.66
- Down: 1h close < 1,524 → targets 1,494.43–1,463.93
- Invalidation: Breakouts need confirmation via sustained closes beyond trigger levels; current read favors a downside confirmation unless a strong intraday reversal occurs.
- Contextual notes: Market breadth is weak (0% above SMA50), BTC correlation is high (0.91 over 72h). ETF flow data suggests mixed signals but should not be treated as ETH-specific primary drivers.
Drivers
Breakout 7D contribution -3.11; BTC dominance z-score contribution 2.97; FNG value -2.69; VIX delta 1D -2.54; Stable market cap z-score 1.85; NASDAQ100 return 1D 1.82 Vol regime is low; vol of vol 0.0168; BTC return 24h around -0.01; BTC dominance at ~56.1% with slight decline over 7 days Global risk assets softness (cross-market risk-off signal); F&G (Fear & Greed) near Extreme Fear
ETF Flows (BTC/ETH)
ETF flow data provided is BTC/ETH only and should be interpreted as context rather than a primary signal for ETH price action. BTC/ETH ETF data can influence broader market risk sentiment and liquidity but is not a direct ETH buy/sell signal.
1D +$629.8M; 5D +$198.4M; 10D +$585.2M 1D +$101.2M; 5D -$20.8M; 10D +$81.6M
What to Watch Next
- Monitor 1h closes near the 1,588 resistance for potential breakout confirmation or rejection.
- Watch for a sustained move below 1,524 to confirm downside target around 1,494–1,464.
- Track BTC dominance and broad market risk sentiment as cross-market signals may tighten ETH directional bias.
- Observe ETF flow momentum in BTC as a contextual risk-on/off gauge rather than a direct ETH trigger.
Hashtags: #ETH #Ethereum #CryptoAnalysis #MarketSnapshot #TechnicalAnalysis #BTC #Bitcoin #ETFFlows #RiskOnOff #MarketSentiment #CryptoNews