Market Snapshot
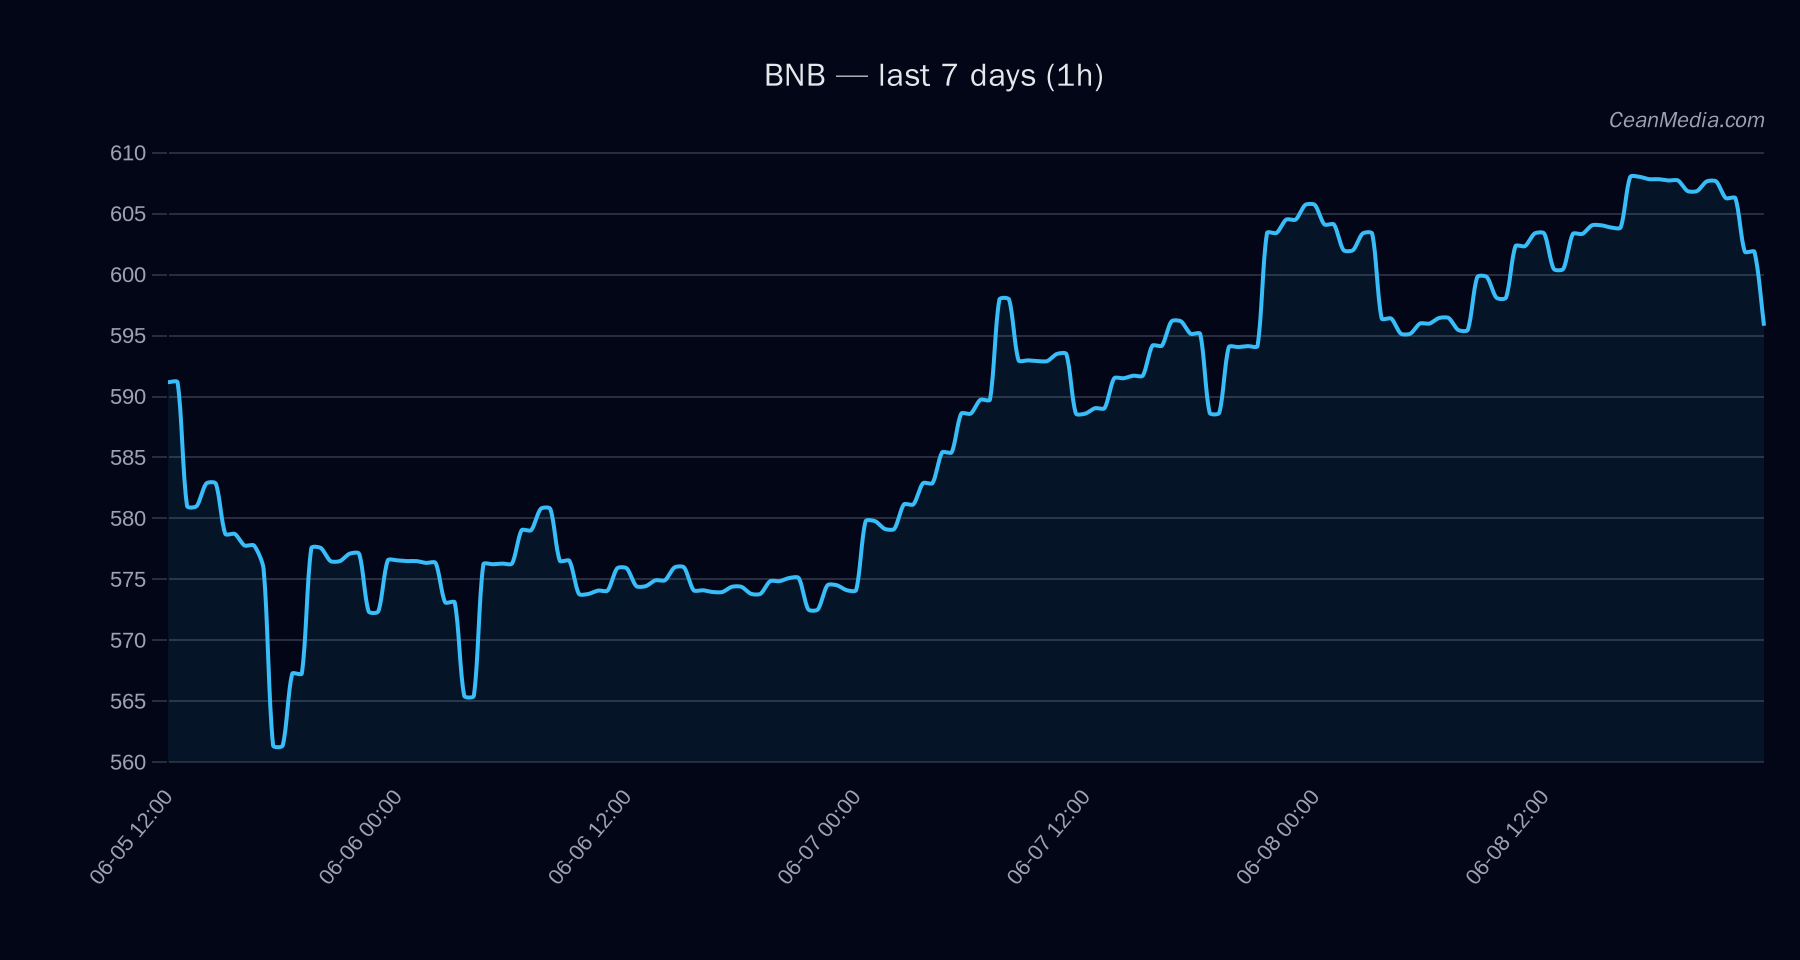
As of 2026-06-09, BNB sits in a mixed technical setup with bearish pressure and low conviction (confidence 5/100). The composite score is -1.3 with conflicting signals. Price sits near the mid-range, with a close of 595.9 and an anticipated range between ~551.9 and ~599.99 over a 20th/80th percentile band. Breadth modeling shows roughly even participation above the 50-day average, and BTC correlation stands high (~0.87 over 72h), suggesting broader market dynamics are influencing risk assets alongside idiosyncratic factors for BNB.
ETF flow context is included to provide market-wide liquidity and sentiment backdrop, noting that the ETF data covers BTC and ETH only and should be treated as contextual rather than a primary signal for BNB trading decisions.