Market Snapshot
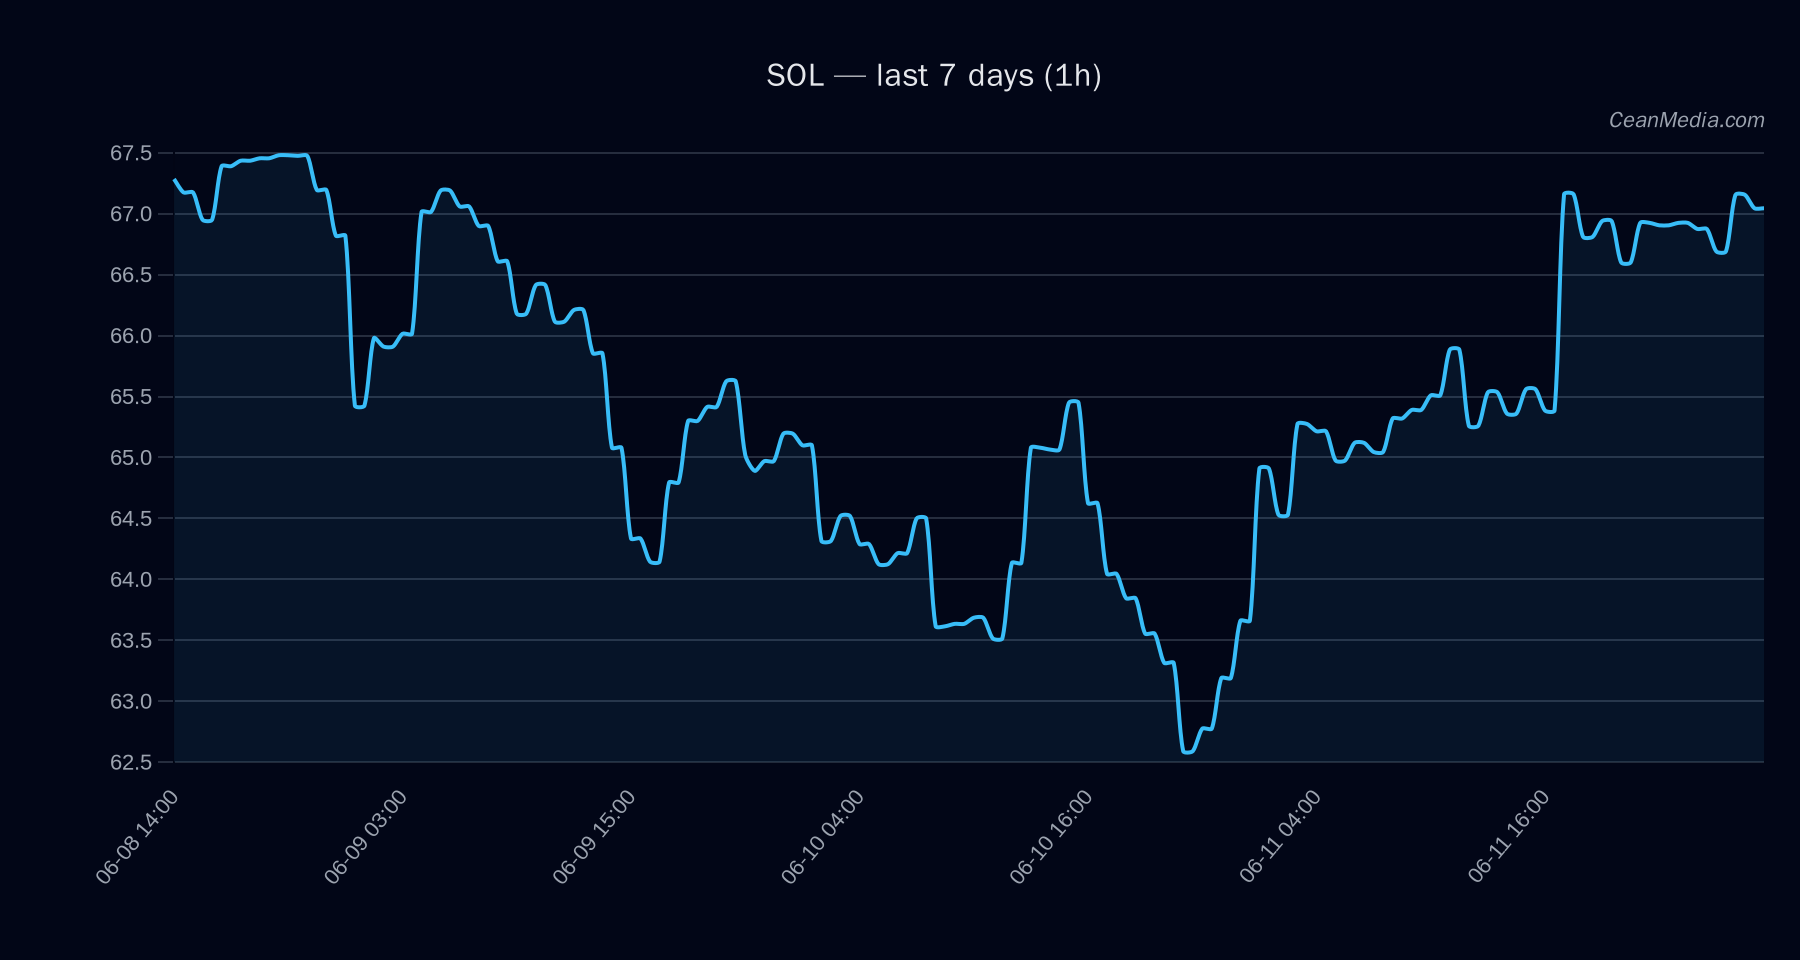
On 2026-06-12, SOL trades around the mid-60s with a current close near 67.1. The model forecast leans to a down bias (56% probability), while the technical trend presents a sideways posture with RSI at 63. Market conditions show very low volatility and a broad market breadth indicating risk assets are supportive overall, though sentiment remains in extreme fear territory. Key support is near 65.8 and major support near 63.9; resistance sits around 68.4 with a major level at 71.7. The forecast range for the next period spans roughly 60.6 to 70.5, with a 50th percentile around 66.5.
Technical Analysis: SOL
+0.6; conflicts: 3 EMA12>EMA26, SMA50 Down-break triggers below 65.8 lead to 64.44/63.13; Up-break above 68.4 lead to 69.81/71.18 60.61 – 70.50; P50 at 66.47 Inside range currently; no breakout confirmation
Drivers
Return 24H: 0.03; EMA slope: 0.001; Funding Z-score: 0.67; Basis Z-score: 0.04; OBI EMA5: 0.065; BTC 24h return: 0.013 Trend strength 0.82; Breakout tendency weak (-1.31 distance from MA signal on average) Cross-market risk assets supportive; sentiment at extreme fear (F&G: 12)
ETF Flows (BTC/ETH)
Contextual note: ETF flow data here cover BTC and ETH only. This information is provided for market context and is not a primary signal for SOL trading decisions. Recent data show:
1D: -$22.5M; 5D: +$224.6M; 10D: -$192.4M 1D: -$15.9M; 5D: +$91.3M; 10D: -$8.4M
Interpretation: Net shifts in BTC/ETH ETF allocations suggest a cautious, mixed risk posture with near-term inflows concentrated in the 5-day window. While not specific to SOL, ETF activity contributes to broader liquidity dynamics and risk-on/off sentiment that can influence correlated assets.
What to Watch Next
- Monitor for a breakout above 68.4 to validate potential upside toward 69.8–71.2.
- Watch for a break below 65.8 to confirm downside continuation toward 64.4–63.1.
- Track volume and volatility regime shifts, as volatility remains very low and could precede a compression-break dynamic.
- Consider how BTC/ETH ETF flow trends evolve over the next 5–10 days, given their potential correlation with SOL during risk-on/risk-off cycles.
Hashtags: #solanalysis #cryptomarket #tradingview #technicalanalysis #etfflows #btc #eth #riskon #riskoff #volatility #crypto-trends #marketinsight