Market Snapshot
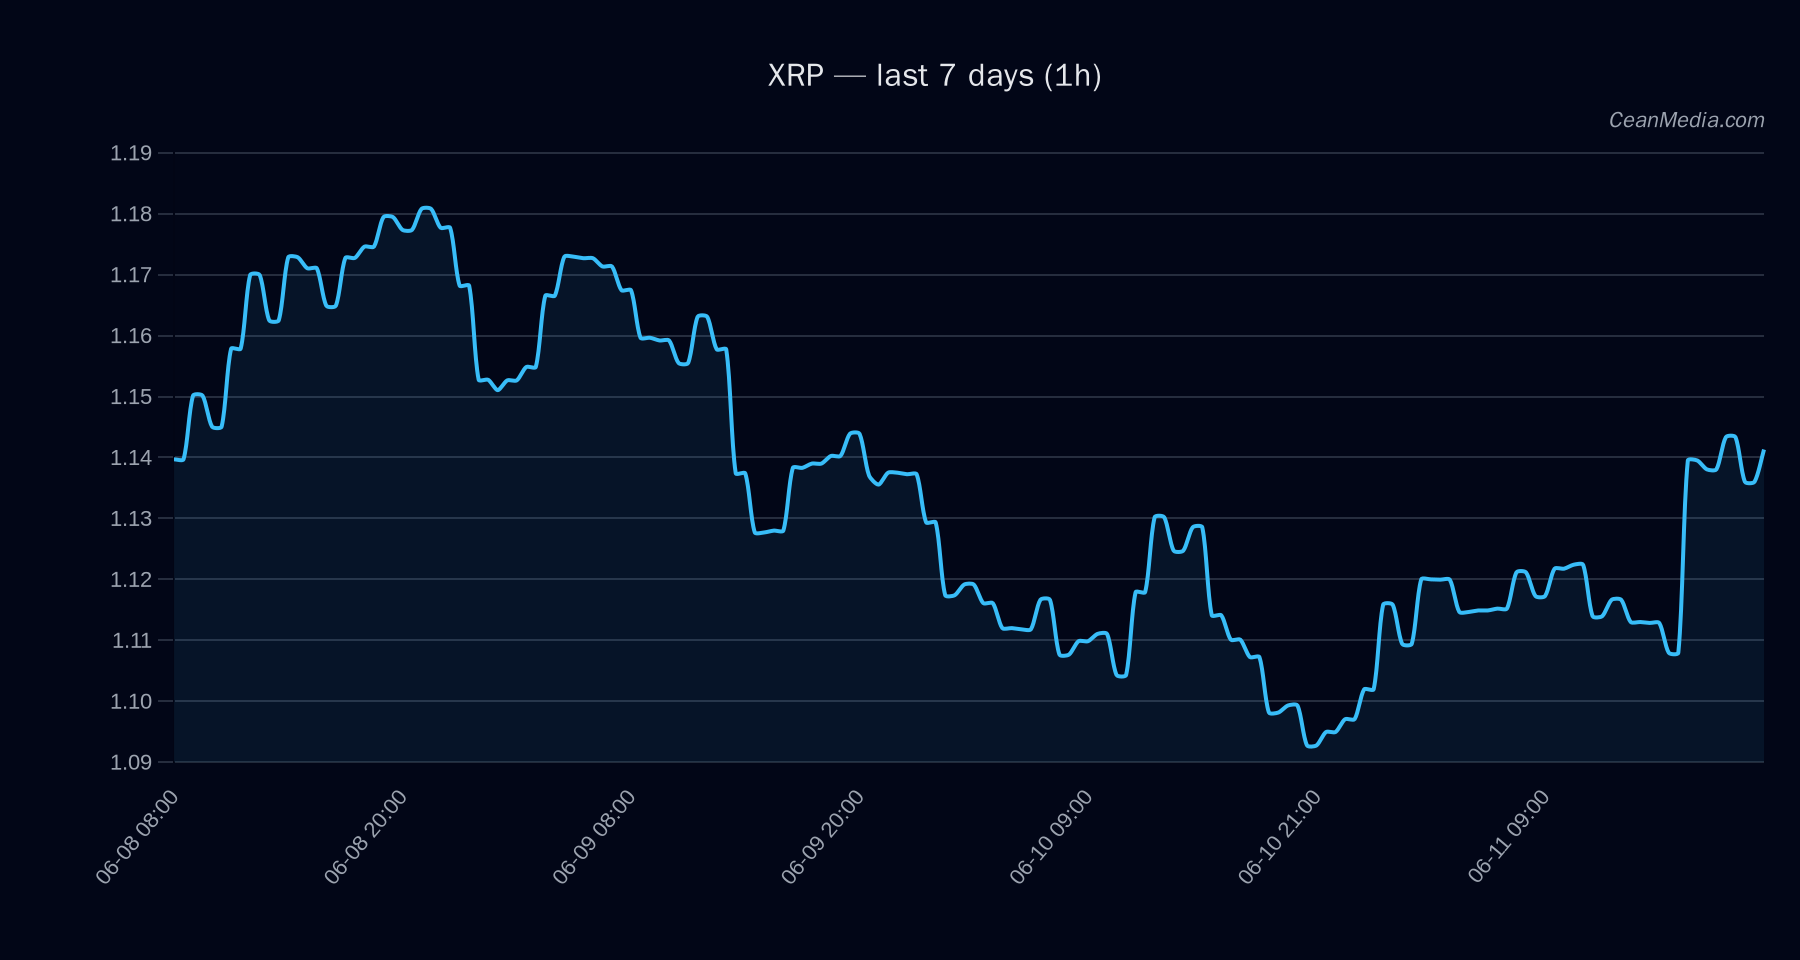
As of 2026-06-11, XRP trades near critical support and resistance boundaries with a mixed bias. The composite view signals bearish pressure but with low conviction, set against a backdrop of very low volatility and broad market softness in risk assets. BTC correlation remains high, underscoring cross-market sensitivity during this period.
Technical Analysis: XRP
: - Support: near 1.12; major 1.10
- Resistance: near 1.16; major 1.26
- Up: close > 1.16 -> 1.1909/1.2143
- Down: close < 1.12 -> 1.0994/1.0769
Drivers
(contributions): - Return 24H: 0.04
- EMA slope: +0.0021
- Funding z-score: +0.37
- Basis z-score: +0.67
- Order-book imbalance (EMA5): +0.07
- BTC return 24H: +0.04
: Cross-market risk assets softness; stablecoin liquidity contracting; sentiment shows extreme fear (F&G 12). BTC dominance ~56.3%, 7-day BTC price correlation ~0.88 with XRP context. : Vol regime very low; breadth robust (100% above SMA50); BTC/altcoin breadth indicates risk-off dynamics.
ETF Flows (BTC/ETH)
Contextual signal: ETF flow data is provided for BTC and ETH only and is not a primary signal for XRP trades. The latest snapshot shows:
- BTC ETF: 1D -$213.9M, 5D +$251.5M, 10D -$119.3M
- ETH ETF: 1D -$35.5M, 5D +$103.8M, 10D -$56.6M
Interpretation: The BTC ETF data reflects modest near-term outflows on the current day but net inflows over a 5-day horizon, suggesting a nuanced risk appetite. This context can influence correlations and market mood but should not be treated as XRP-specific guidance. In this period, XRP’s behavior appears more closely linked to cross-asset risk sentiment and USD liquidity conditions than to ETF flows alone.
What to Watch Next
- Monitor for a breakout above 1.16 to confirm potential upside toward 1.1909–1.2143.
- Watch for a breach below 1.12 to validate a move toward 1.0994–1.0769.
- Observe changes in cross-asset risk sentiment and BTC/ETH ETF flow momentum as part of external market cues.
- Validate trigger confirmations before relying on directional conviction, given the current mixed signal and low certainty.
Hashtags: # XRP # cryptoanalysis # XRPUSD # markettrends # ETFflows # BTC # ETH # riskoff # liquidity # volatility # priceaction