Market Snapshot
Bitcoin (BTC) remains range-bound with a bullish bias initialization but limited by a very low volatility regime. The current price sits near the upper end of a defined range, with a forecast range indicating support around the mid-60k and resistance near 65.75k. Market breadth remains positive, and correlation to BTC is at unity with other risk assets showing supportive cues, though stablecoin liquidity is contracting on a 7‑day view.
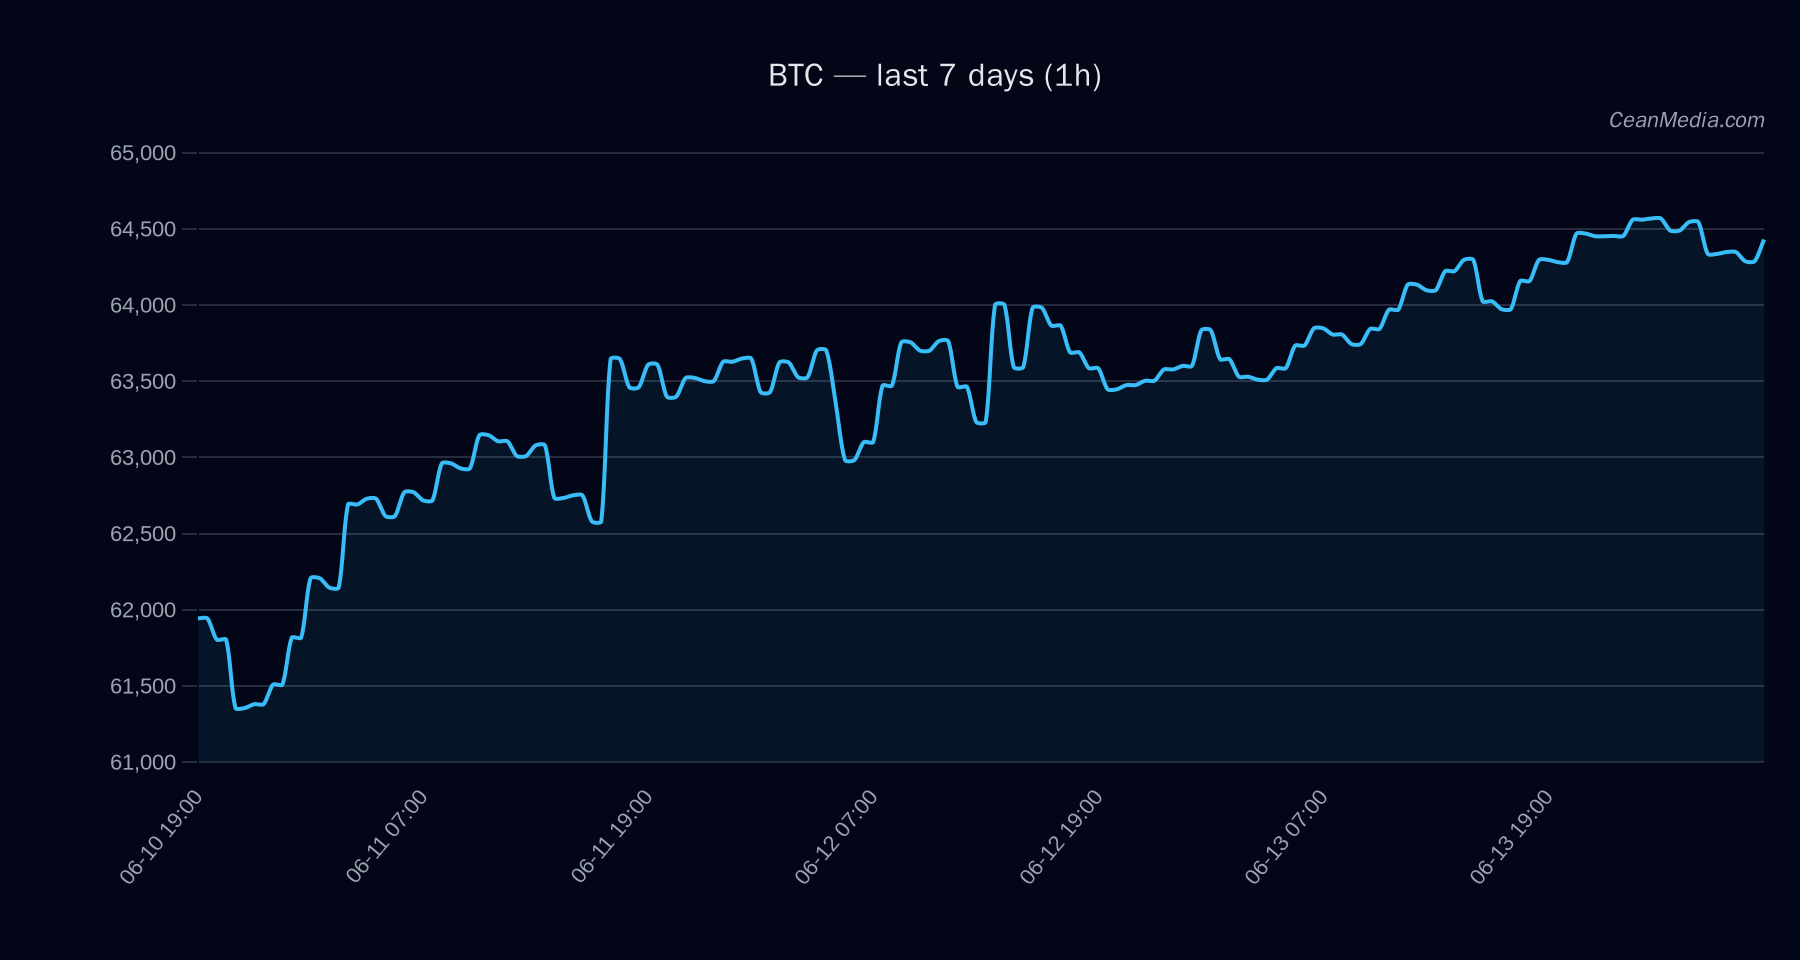
Technical Analysis: BTC
- bullish (certainty 58/100).
- Close around 64,471.73.
- EMA12 above EMA26; SMA50 above SMA200; RSI ~60; 24h volatility = 0.18%; Volatility regime: Very low.
- Model forecast leans down (47%), with 37% up, 17% sideways. Overall composite reading reinforces a cautious bullish stance.
- Support near 63,175; major support ~61,375. Resistance near 65,750; major resistance ~67,575.
-
- Up trigger: close > 65,750 on a 1h basis targets 67,076.39 – 68,391.61.
- Down trigger: close < 63,175 on a 1h basis targets 61,918.65 – 60,655.00.
- Price movement inside defined range reduces confidence in an immediate breakout or breakdown without a sustained close beyond trigger levels.
Drivers
- Return 24h, EMA slope, funding Z-score, basis Z-score, order-book imbalance (EMA5), BTC return 24h.
- Vol regime is very low; breadth is strong (83% above SMA50); BTC dominance 56.6%, slight positive 7‑day delta. Overall trend strength appears modest with mixed signals from funding and basis measures.
- Cross-market risk assets supportive; stablecoin liquidity contracting; sentiment indicates extreme fear (F&G: 18).
ETF Flows (BTC/ETH)
The ETF flow data presented is limited to BTC and ETH only and should be interpreted as contextual information rather than a primary signal for BTC pricing. 1D BTC ETF flows show a net positive inflow of approximately $85.9M, with 5D and 10D frames showing net outflows (-$319.3M and -$120.9M respectively). ETH ETF data indicates negative flows over similar horizons. This pattern suggests episodic risk-on/risk-off dynamics but is not determinative for BTC price action on a near-term horizon.
- : 1D +$85.9M; 5D -$319.3M; 10D -$120.9M
- : 1D -$4.9M; 5D -$14.8M; 10D -$35.6M
What to Watch Next
- Monitor close above 65,750 for confirmation of a bullish breakout toward 67,076.39–68,391.61.
- Watch for a break below 63,175 to assess downside risk toward 61,918.65–60,655.00.
- Assess changes in volatility regime and breadth as potential precursors to a larger move.
- Keep an eye on ETF flow shifts as contextual risk signals but not as primary drivers for BTC in the near term.
Hashtags: #Bitcoin #BTCAnalysis #CryptoMarkets #ETFFlows #BTCLevels #TechnicalAnalysis #MarketSnapshot #CryptoTrading #RiskOn #Volatility #Liquidity #MarketContext