Market Snapshot
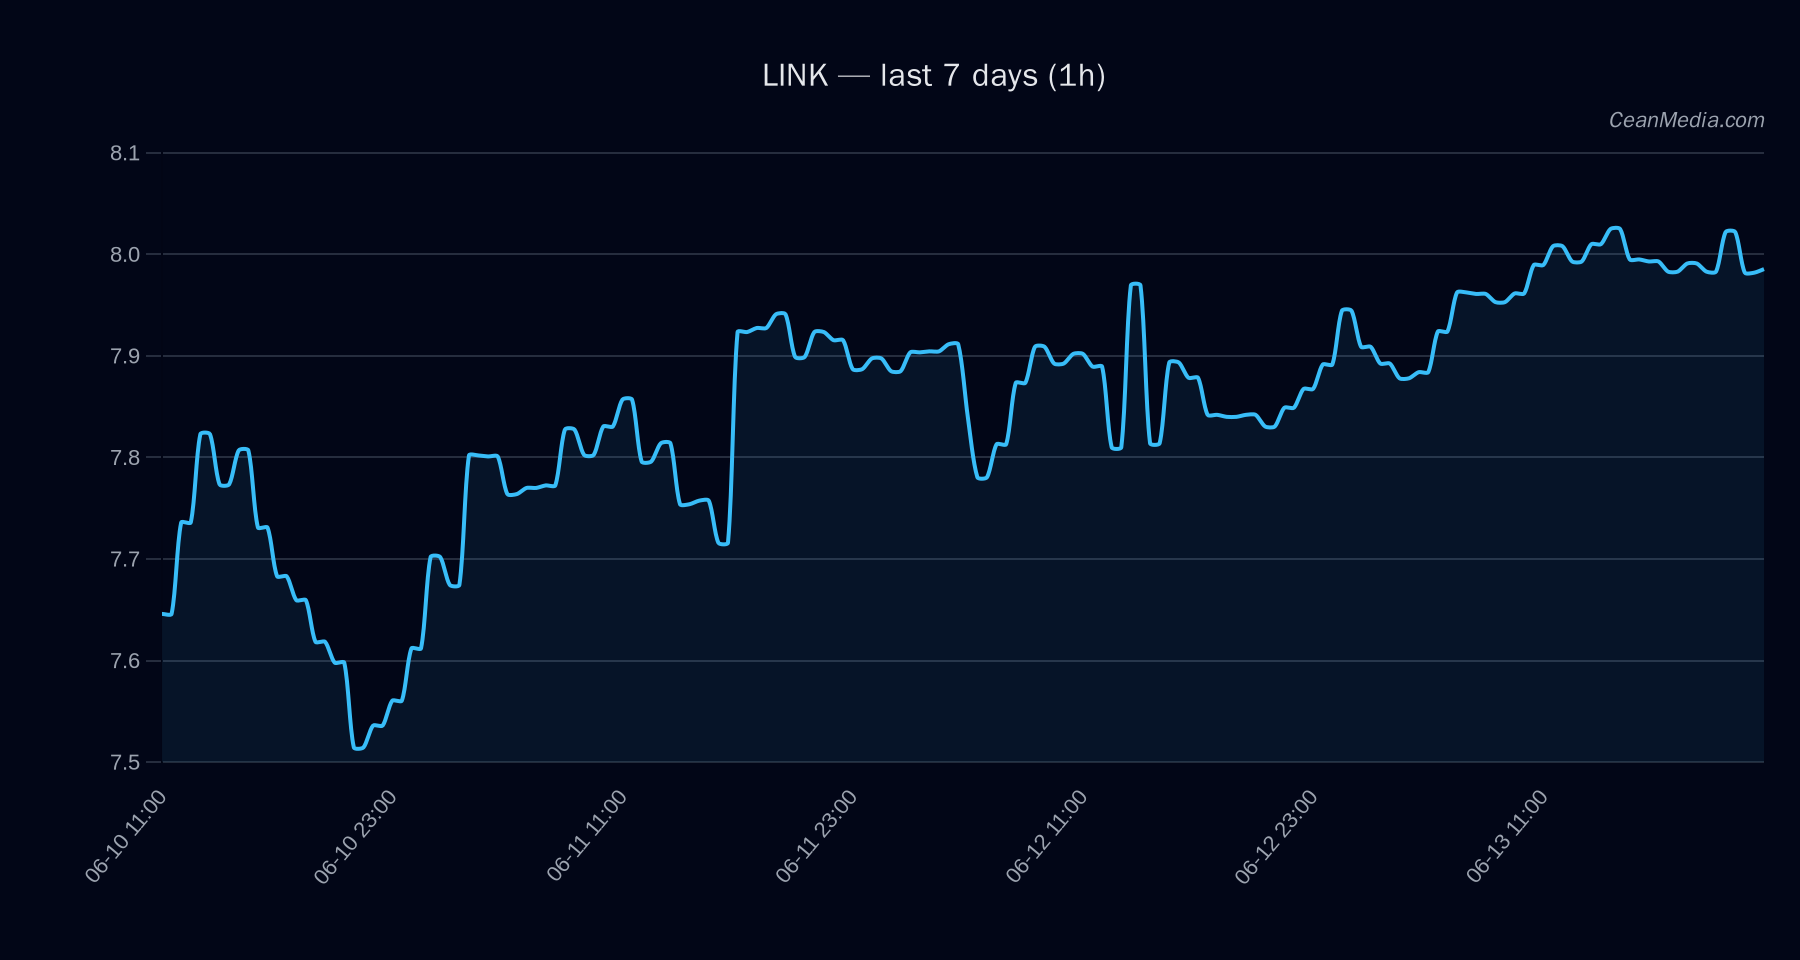
On 2026-06-14, LINK trades around support at 7.8 and resistance at 8.12, with a final bias categorized as bullish but with low certainty (40/100). The composite score stands at +2.8 with no conflicts reported. The price closed at 7.97 and the forecast range for the coming period is 7.62 to 8.25 (P20-P80), indicating a sideways morphology in the near term.
Technical Analysis: LINK
EMA12>EMA26; SMA50>SMA200; RSI 52; volatility (σ24h) 0.31%; very low vol regime Close 7.97; within inside-range dynamics; no breakout confirmation yet Support near 7.8; major support around 7.54; Resistance near 8.12; major resistance at 8.74
Drivers
Stable MCAP Z-Score (-4.19 value, contrib 1.62); FNG Z-Score (-0.77, contrib 0.82); LS Global Z-Score (1.92, contrib 0.79); Spread BP (4.35, contrib -0.71); Depth USD 10BP LOG1P (-3.44, contrib -0.45); FNG Value (-8.21, contrib 0.38) overall forecast remains sideways with bullish TA signals; RSI neutral around 52; low volatility regime supports range-bound movement Cross-market risk assets supportive; stablecoin liquidity contracting (−65.97% 7D); Sentiment indicator F&G: 18 (Extreme Fear)
ETF Flows (BTC/ETH)
Context: ETF flow data provided pertains to BTC and ETH only and should be interpreted as macro risk-on/off context rather than a direct signal for LINK. The BTC ETF shows a 1D inflow of +$85.9M, with 5D and 10D losses (−$319.3M and −$120.9M respectively). The ETH ETF shows 1D outflow of −$4.9M, with 5D and 10D losses (−$14.8M and −$35.6M respectively). These flows indicate short-term shifts in digital asset risk appetite that can influence correlated markets but are not primary drivers for LINK’s technical setup.
What to Watch Next
- Watch for a close above 8.12 on an intraday or hourly basis to validate the upside trigger toward 8.29–8.45.
- Monitor for a break below 7.8 with close data to confirm downside targets around 7.65–7.50.
- Maintain awareness of BTC/ETH ETF flow trends as potential risk-on/off context, while treating them as secondary signals for LINK momentum.
- Observe volatility regime and breadth signals; continued very low volatility and breadth > 50 could support range-bound behavior.
Hashtags: #LinkAnalysis #CryptoMarkets #TechnicalAnalysis #ETFFlows #BTC #ETH #MarketSnapshot #PriceLevels #TradingSignals