Market Snapshot
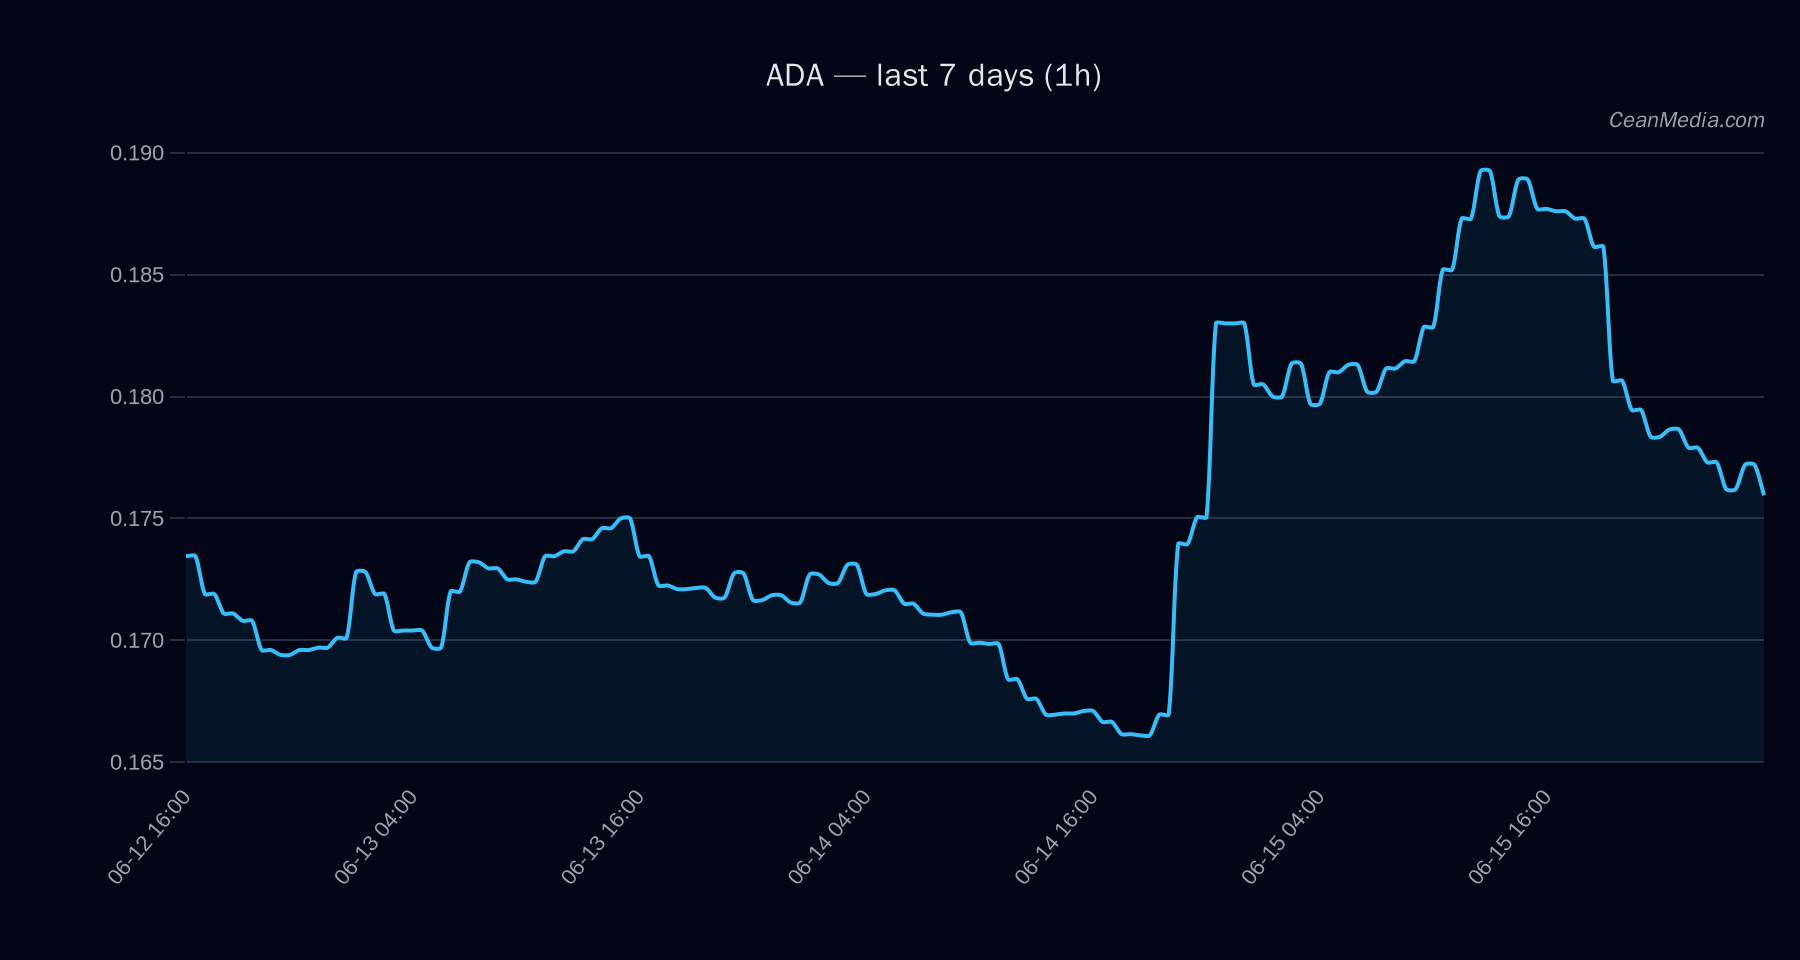
As of 2026-06-16, ADA trades with a mixed to neutral bias. The composite signal remains slightly negative (-0.2) with low certainty (5/100). Price sits near key intraday levels, with a close of 0.1766 and a forecast range suggesting modest upside potential within the 0.1686–0.1894 band. Overall market breadth remains robust (67% above the 50-day moving average), while BTC correlation stands at 0.69 over a 72-hour horizon. The macro context features extreme fear in sentiment metrics, though breadth signals support further activity in risk assets.
Technical Analysis: ADA
-0.2 with 2 conflicts. Up 51%, Side 6%, Down 43% (horizon: 24h). sideways; RSI 40. EMA12
Drivers
Return 24h slightly negative (-0.02), EMA slope negative (-0.0033), and Funding Z-Score (-0.985) weighing on the signal. Drawdown 30D contributes negatively (-2.57), trend strength moderate (0.467), and distance from MA small (-0.0043). Vol regime remains very low, with BTC 24h return barely positive (0.003). 67% of assets above SMA50; BTC dominance about 56.5% with a slight uptick. Extreme Fear (F&G: 23) suggests cautious positioning, though intra-asset dynamics show some purchasing pressure in order flow (+0.6 contribution from Flow index).
ETF Flows (BTC/ETH)
The ETF flow context provided covers BTC and ETH instruments only and should be interpreted as background market liquidity signals rather than ADA-specific catalysts. BTC ETFs show a net negative flow over 1D and 5D horizons with a smaller positive 10D movement, while ETH ETFs show a modest positive 1D flow and larger negative 5D flow with a positive 10D. This pattern can reflect shifting risk appetite and liquidity preferences across large-cap crypto assets, but it is not a primary signal for ADA trading decisions. Use this as contextual information alongside ADA-specific indicators.
1D: -$64.8M; 5D: -$292.7M; 10D: +$77.5M. 1D: +$22.5M; 5D: -$74.7M; 10D: +$35.3M.
What to Watch Next
- Watch for a close confirmation above 0.18 to trigger potential moves toward 0.1837–0.1873.
- Monitor intraday volatility given the very low regime; any breakout or breakdown should be validated with a sustained close beyond triggers.
- Observe ETF flow shifts in BTC/ETH for shifts in risk-on/risk-off sentiment, while recognizing they are contextual rather than primary ADA drivers.
- Keep an eye on the 0.16 major support and related risk if downside pressure intensifies in broader markets.
Hashtags: #ADA #CryptoTechnical #MarketSnapshot #ETFFlows #BTC #ETH #Altcoins #TradingAnalysis #TechnicalAnalysis #RiskOnOff #Liquidity