Market Snapshot
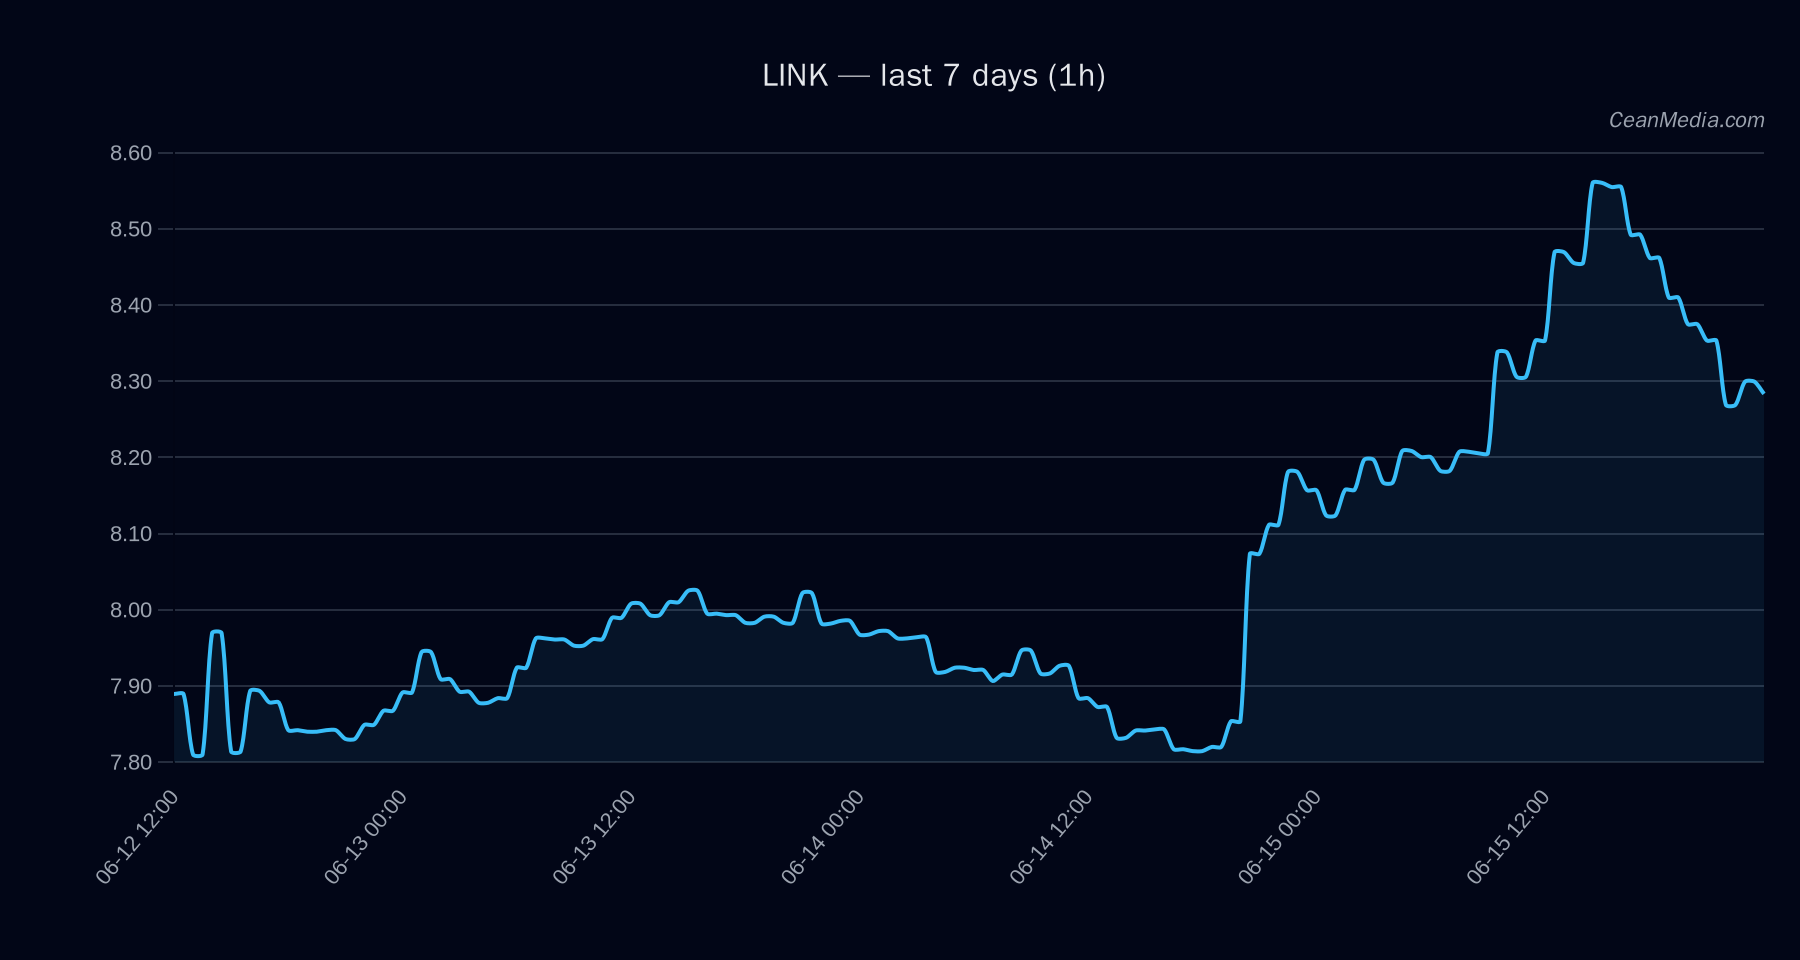
Asset: Chainlink (LINK). As of 2026-06-16T01:26:00Z, price closed near 8.284. The broader environment shows very low volatility with breadth suggestive of broad participation above the 50-day moving average. Cross-asset context indicates risk assets experiencing supportive conditions, while stablecoin liquidity shows contraction and sentiment sits in extreme fear territory. BTC dominance sits around 56.5% with a modest weekly increase, and the BTC/ETH ETF flow context remains cautiously constructive for BTC.
Technical Analysis: LINK
: +0.5 (conflicts 0) : bullish (EMA12 > EMA26, SMA50 > SMA200, RSI ~50, σ24h ~0.65%, very low volatility)
Key Levels
- Support: near 8.12 (major 7.54)
- Resistance: near 8.44 (major 9.08)
Forecast Range
- P50: 8.4333
- P20-P80: 7.6224 – 8.7781
Triggers
- Up: 1h close > 8.44 → potential move toward 8.6187 / 8.7877
- Down: 1h close < 8.12 → potential move toward 7.956 / 7.7936
Invalidation: Breaks beyond defined levels would require confirmation through subsequent closes and volume changes; current signal aligns with a benign risk environment but remains contingent on intraday dynamics.
Drivers
: SPREAD BP (-3.71), LS GLOBAL Z-SCORE (-2.02), BTC DOMINANCE (+0.71), STABLE MCAP (LOG1P) (+0.67), VOL REGIME (+0.61) : Taker flow indicates selling pressure (-28.8%), long crowded positioning (1.42x) : Cross-market risk assets supportive, but stablecoin liquidity contracting; sentiment shows extreme fear : Very low volatility regime, implying tight ranges and potential for breakout validation via triggers
ETF Flows (BTC/ETH)
Contextual note: ETF data provided here pertains only to BTC and ETH. It should be interpreted as market context and not as a primary signal for LINK. BTC ETFs show a 1D net inflow (+$85.9M) with negative 5D and 10D performance, while ETH ETFs show a small 1D outflow (-$4.9M) with larger negative flows over 5D and 10D. These flows reflect macro risk-on/off signals in the crypto market but are not direct drivers for LINK price action.
: 1D +$85.9M | 5D -$319.3M | 10D -$120.9M : 1D -$4.9M | 5D -$14.8M | 10D -$35.6M
What to Watch Next
- Watch for a close above 8.44 on an intraday basis to validate potential upside continuation toward 8.6187–8.7877.
- Watch for a sustained close below 8.12 to signal downside risk toward 7.7936–7.956.
- Monitor volatility regime. Continued very low volatility increases the likelihood of a breakout move if triggers are hit with corroborating volume.
- Keep context of BTC/ETH ETF flows; while not primary signals for LINK, shifts in BTC/ETH liquidity can influence risk sentiment and correlated assets.
Hashtags: #LinkAnalysis #CryptoMarkets #TechnicalAnalysis #ETFFlows #BTC #ETH #MarketContext #Liquidity #RiskSentiment #Altcoins
Hashtags: #LinkTechnical #MarketSnapshot #TradingLevels #PriceAction #Volatility #RiskOnOff