Market Snapshot
ETH faces a near-term priced range with defined support and resistance levels. The instrument is trading around mid-1,700s, with a slight bullish bias in the short term but low certainty. Cross-market context indicates risk assets remain soft, while volatility is very low. ETF data for BTC/ETH provides an ancillary backdrop rather than a primary signal for ETH specifically.
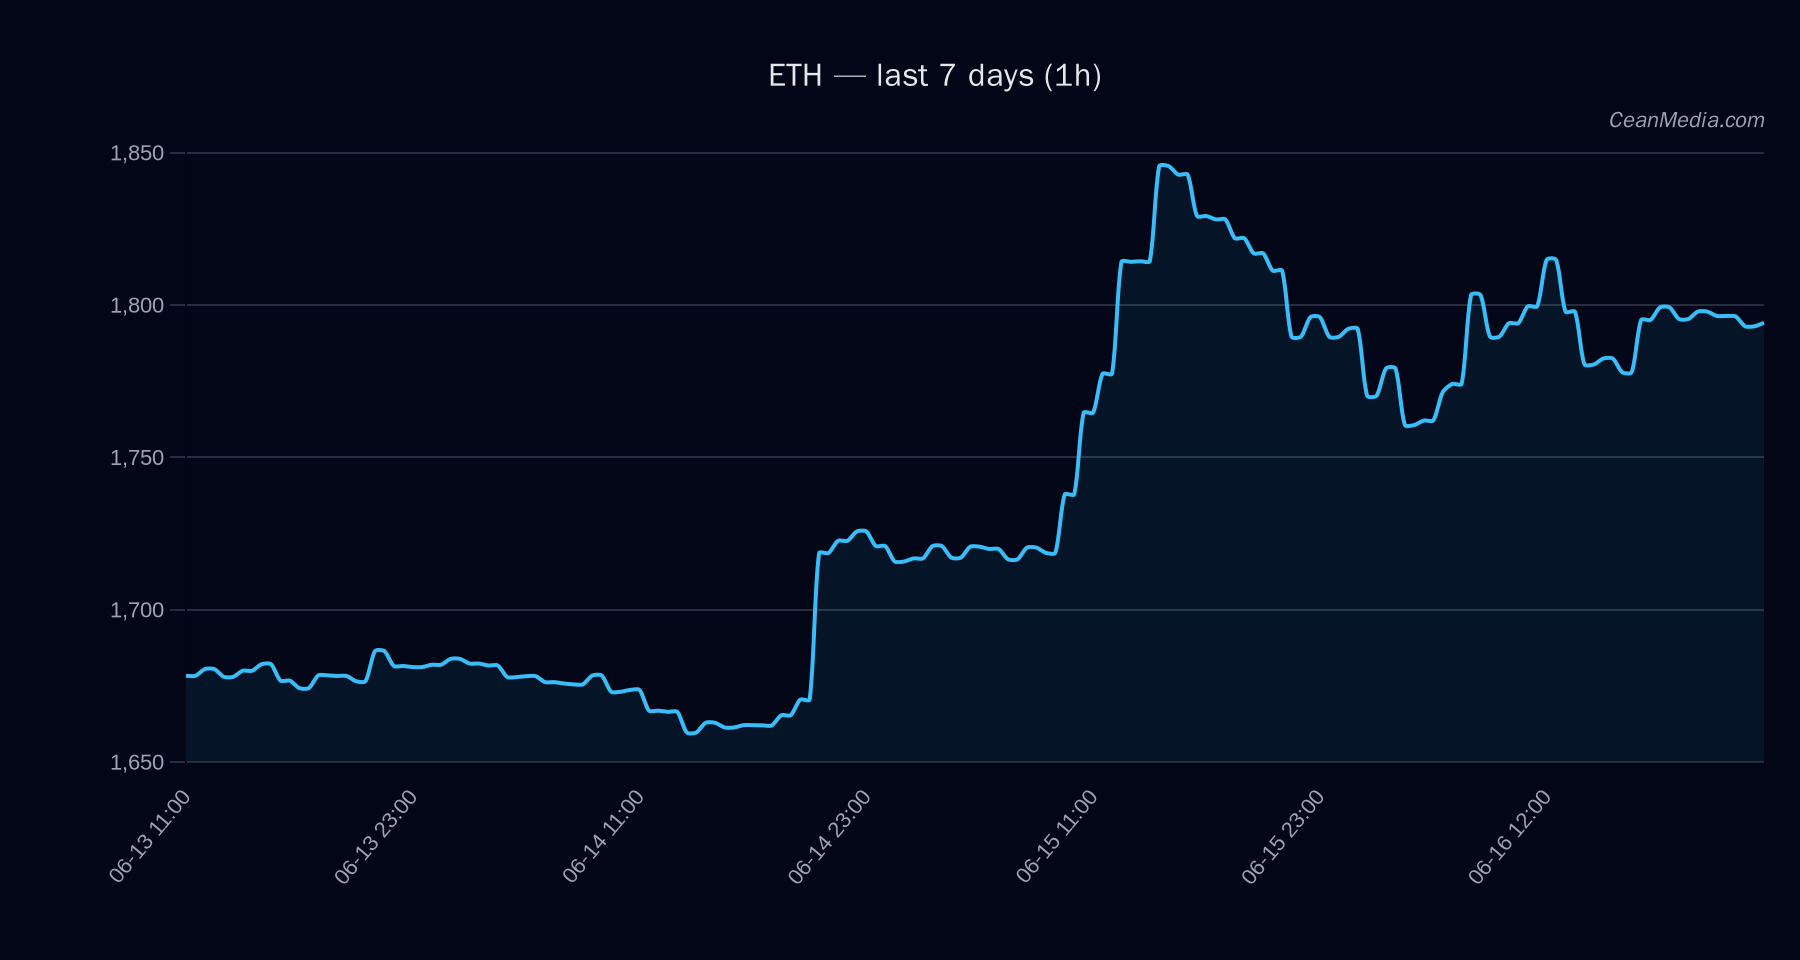
Technical Analysis: ETH
+0.9 1,785.75 down 50% | up 40% | side 10% bullish; RSI 49
Support near 1,750; major support 1,678
Resistance near 1,822; major resistance 1,894P50 1,805.54; P20-P80 1,655.09 – 1,929.26 EMA slope, funding Z-score, basis Z-score, OBI EMA5, BTC 24h return
Drivers
EMA slope; Funding Z-score; Basis Z-score; OBI EMA5; BTC 24h return Very low vol regime; RSI near neutral; 24h volatility at 0.66% Cross-market risk assets soft, extreme fear sentiment (F&G 22)
ETF Flows (BTC/ETH)
Context note: ETF flow data shown here covers BTC and ETH only and is intended as supplementary context. ETF data is not a primary signal for ETH and should be interpreted with caution within the broader market framework.
1D -$64.8M; 5D -$292.7M; 10D +$77.5M 1D +$22.5M; 5D -$74.7M; 10D +$35.3M
The BTC and ETH ETF flows suggest mixed near-term positioning, with BTC showing a larger short-term outflow over 5 days, while ETH shows a small positive one-day inflow. This context indicates cautious risk-on/off dynamics rather than a decisive ETH-led signal.
What to Watch Next
- Watch for a close above 1,822 to validate a potential push toward 1,857.89 – 1,894.32 in the immediate horizon.
- Monitor a break below 1,750 for potential moves toward 1,715.03 – 1,680.03.
- Observe changes in market breadth and BTC correlation, as a sustained uptick could reinforce bullish bias.
- Keep an eye on volatility regime; a shift from very low could precede sharper moves.
Hashtags: #ETH #CryptoAnalysis #TechnicalAnalysis #ETFFlows #MarketSnapshot #PriceLevels #TradingStrategy #BTCETF #ETHETF #MarketContext #RiskOnOff #CryptoTrends