Market Snapshot
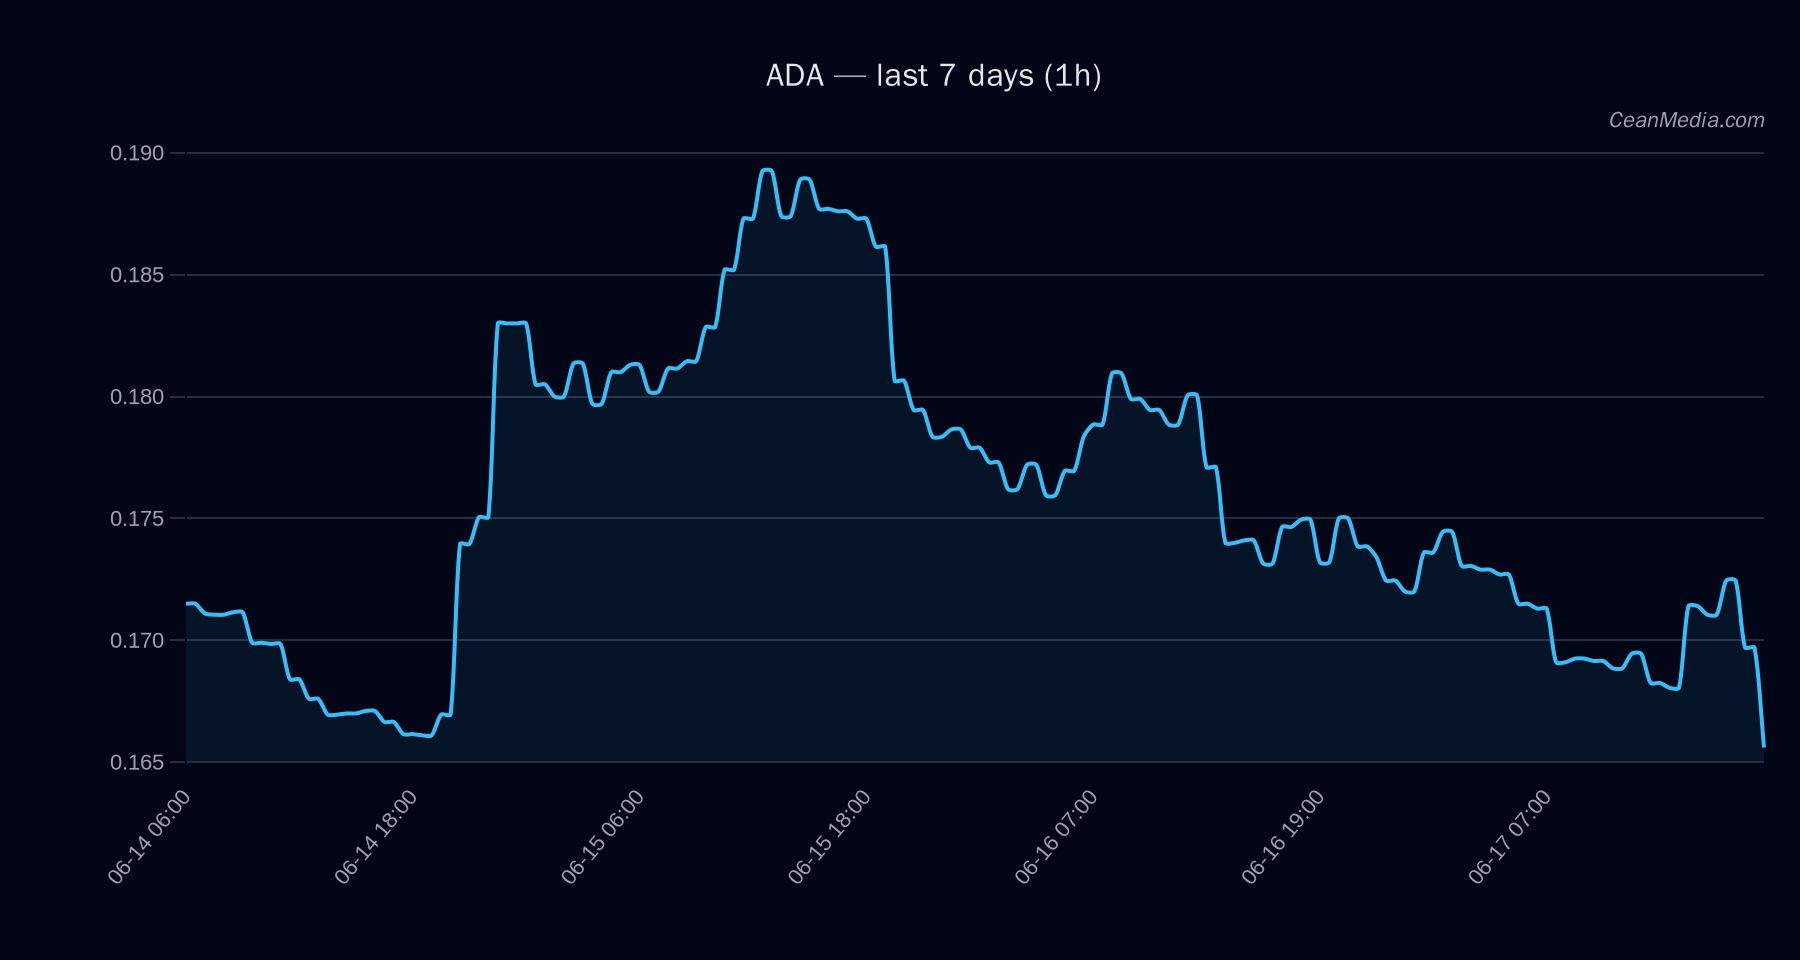
Asset: ADA (Cardano) | Price: 0.167 | Date: 2026-06-17
Market context shows very low volatility with breadth effectively flat against the 50-day moving average. The model indicates a mixed/bearish pressure with low certainty (15/100) and a composite score of -3.6. The forecast distribution favors an upside move in the near term (52% for Up in 24 hours) but with notable risk of sideways or down outcomes.
Technical Analysis: ADA
- : mixed / bearish pressure; certainty low (15/100).
- : TA trend is sideways; RSI at 36 (neutral to bearish on momentum).
- :
- Support near 0.165; major support at 0.16
- Resistance near 0.17; major resistance at 0.185
- :
- Up trigger: close above 0.17 to 0.1737/0.1772
- Down trigger: close below 0.165 to 0.1604/0.1571
- : P50 around 0.1791; P20-P80 roughly 0.1617–0.1791
- : Vol regime very low; ATR 0.0012; 24h σ 0.81%; BTC correlation 0.74; F&G sentiment extreme fear.
- : a sustained move outside the defined trigger levels with confirmation would be needed to shift the directional bias with high conviction.
Drivers
- :
- Return 24h: marginally negative
- EMA slope: modest downward
- Funding Z-score: positive signal
- Basis Z-score: negative signal
- Order-book imbalance (EMA5): minor positive signal
- BTC 24h return: negative
- : overall low vol; trend strength metric indicates some underlying momentum but price action remains range-bound between support and resistance.
- : market breadth with no clear expansion above SMA50; BTC dominance ~56% with recent slight decline signals mixed risk appetite.
ETF Flows (BTC/ETH)
Contextual note: ETF flow data covers BTC and ETH only and should be considered as macro-risk context, not a primary ADA signal. Current data shows BTC ETF flows: +$10.2M (1D), -$205.1M (5D), +$177.4M (10D); ETH ETF flows: +$9.6M (1D), -$24.2M (5D), +$66.7M (10D).
Net, ETF activity indicates a mixed but relatively bullish 10D posture for BTC and mixed to modestly positive for ETH, suggesting some risk-on flow in the larger crypto market. This context can inform LED- and macro- frameworks but does not override ADA-specific technicals.
What to Watch Next
- Watch for a close above 0.17 to validate the near-term upside trigger toward 0.1737–0.1772.
- Monitor for a break below 0.165 to see if downside targets 0.1604–0.1571 come into play.
- Assess shifts in BTC/ETH ETF flows for risk-on/off signals that could influence broader crypto sentiment.
- Keep an eye on market breadth and volatility regime changes to confirm any new directional bias.
Hashtags: #ADA #Cardano #CryptoAnalysis #TechnicalAnalysis #ETFFlows #BTC #ETH #MarketContext #CryptoMarkets #PriceAction #TradingStrategy #RiskOn
Disclaimer
The ETF data presented is limited to BTC/ETH and is provided for contextual market background. ADA-specific trading decisions should rely primarily on asset-specific technicals and price action.