Market Snapshot
As of 2026-06-18, BNB trades with a mixed bias and low volatility. The composite signal indicates bearish pressure with a low certainty (10/100). The model forecast leans toward an upswing in price with a 54% probability, but conflicts exist across factors, and data completeness is noted.
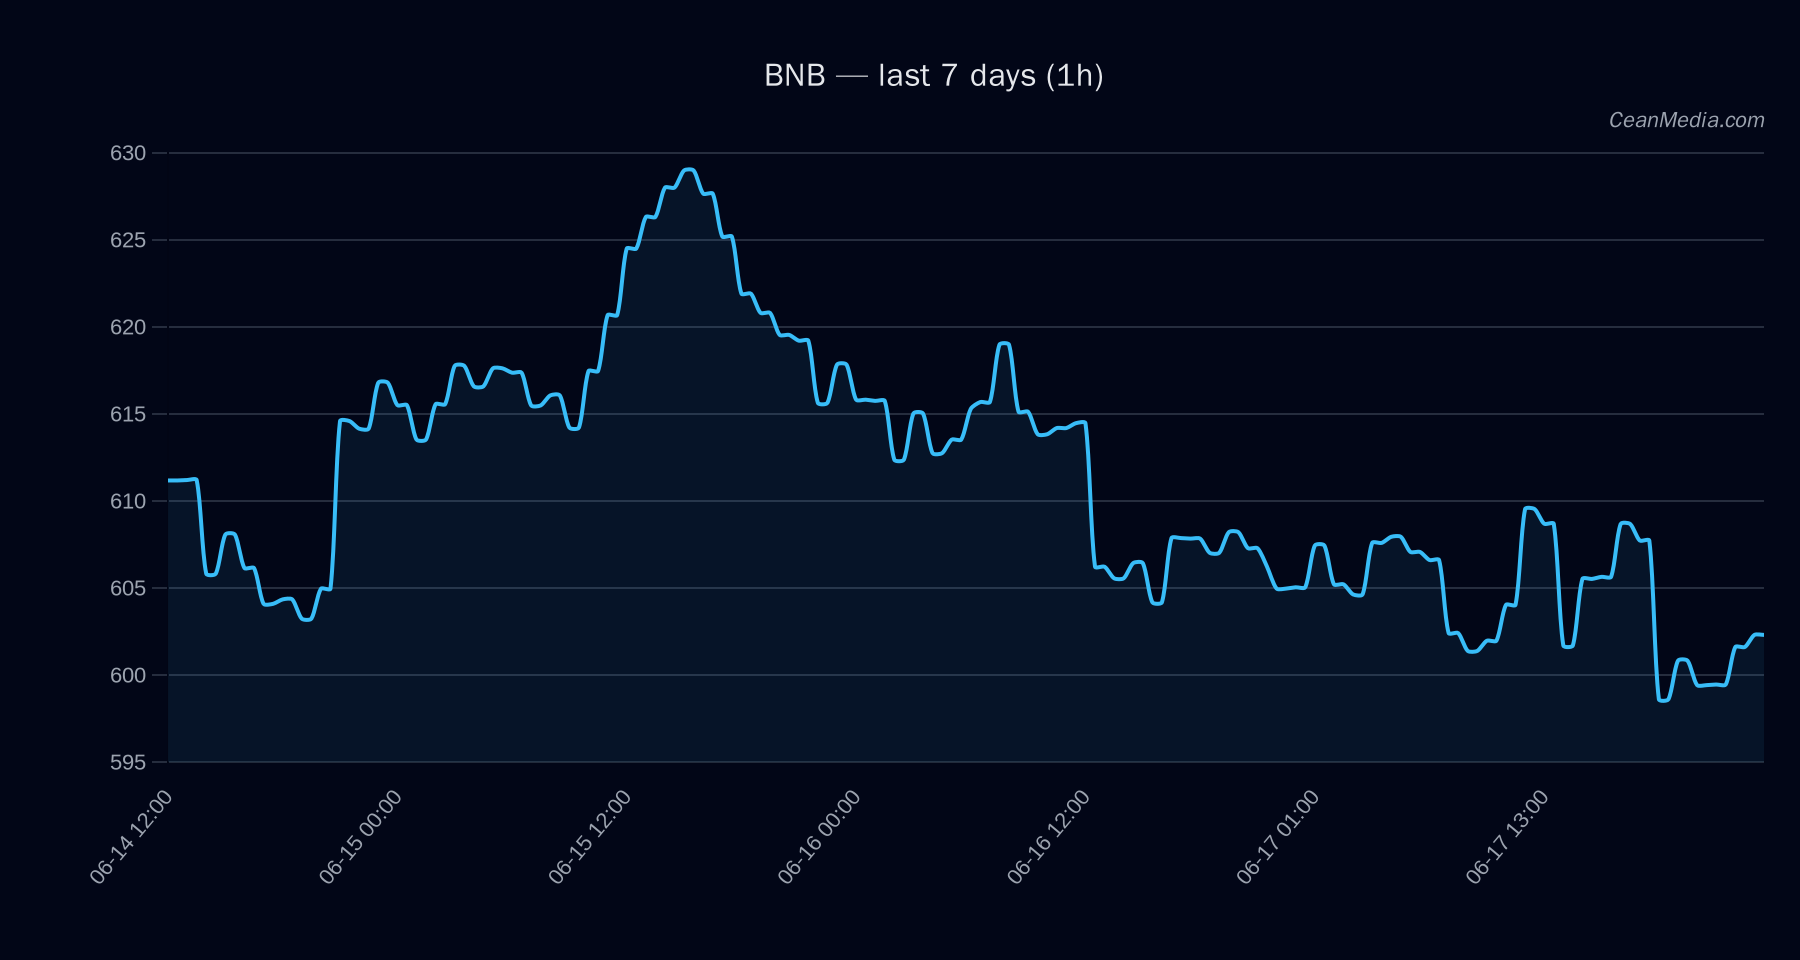
Technical Analysis: BNB
- Price: Close at 602.5.
- Bias: Mixed / Bearish pressure; TA trend: sideways; RSI: 46.
- Key levels:
- Support: near 590; major support at 583
- Resistance: near 615; major resistance at 644
- Forecast range (P50): 603.82 with P20–P80 from 578.54 to 643.97
- Traders’ triggers:
- Upside trigger: 1h close > 615 → potential targets 626.84 / 639.13
- Downside trigger: 1h close < 590 → potential targets 578.64 / 566.83
- Momentum indicators: EMA12 < EMA26; SMA50 > SMA200; σ24h ≈ 0.53%; Volatility regime: Very low
- Composite factors: Model +0.5; TA 0.0; Flow -1.1; Macro/market -1.8; Net effect: contentions persist
Drivers
- Top model drivers: Spread BP positive, FNG value negative, depth USD log, stable cap log, NASDAQ100 5D, TBI EMA10
- Read on momentum: RSI neutral; breadth extremely muted; BTC correlation 0.78 over 72h
- Market context: Vol regime: Very low; F&G sentiment: Extreme Fear; BTC/Dominance ~56%
ETF Flows (BTC/ETH)
The ETF flow data provided is restricted to BTC and ETH and should be treated as contextual rather than a primary signal for BNB. Current reads show:
- BTC ETF: +$10.2M today; 5D net flow negative (-$205.1M); 10D positive (+$177.4M)
- ETH ETF: +$9.6M today; 5D net flow negative (-$24.2M); 10D positive (+$66.7M)
Interpretation: Net BTC/ETH ETF activity indicates a modest risk-on tilt in the shorter windows, but broader 5D frames show mixed sentiment with outflows in recent days. This ETF data provides contextual market liquidity and risk appetite signals but should not be used as a primary driver for BNB directional forecasting.
What to Watch Next
- Monitor for a close above 615 on a 1h or 4h basis to validate upside continuation toward 626.84–639.13.
- Watch for a break below 590 to confirm a shift toward 578.64–566.83 support targets.
- Observe changes in volatility regime and breadth; any broadening of vol or breadth signals could alter the risk premium for BNB.
- Keep an eye on BTC ETF flows for corroboration of risk-on/off shifts, recognizing their secondary role for BNB analysis.
Hashtags: #BNBAnalysis #CryptoMarkets #TechnicalAnalysis #ETFlows #MarketSnapshot #RiskManagement #PriceAction #Liquidity #Altcoins #BlockchainNews #TradingStrategy #MarketContext