Market Snapshot
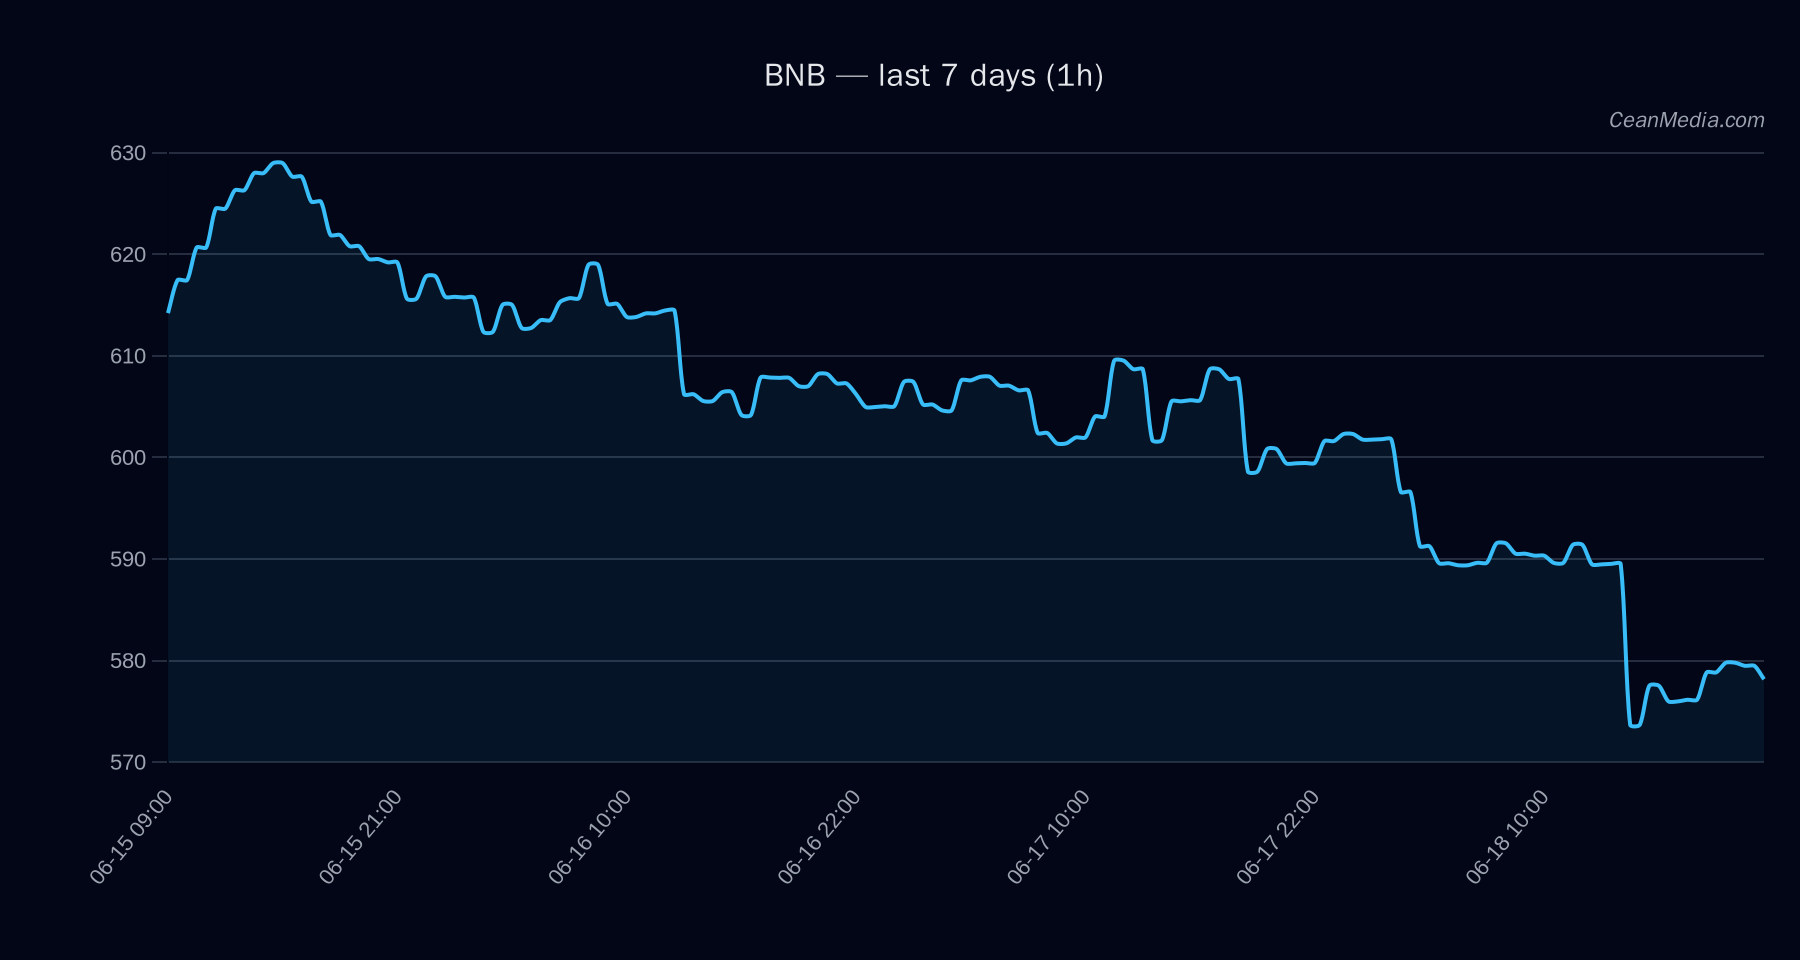
Asset: BNB
Close: 577.24 (as of 2026-06-18)
Vol regime: Very low; ATR: 2.3789; Breadth: 0% above SMA50; BTC correlation: 0.84
Technical Analysis: BNB
- : Mixed / Bearish pressure; certainty is low (5/100).
- : -2.8 with conflicting signals (3).
- : TA trend is bearish. RSI at 32 indicates oversold pressure, but price action lacks a confirming breakout. EMA12 < EMA26 and SMA50 < SMA200 support a bearish slope.
- : Close at 577.24. Current range: supports near 566 (major at 566) and resistance near 589 (major 613). Break above 589 triggers potential move toward 600.56–612.34; break below 566 implies 554.38–543.07.
- : Direction expected to be Up with 64% probability in the next 24 hours, but with low conviction. Range forecast: P20 548.54 / P50 582.35 / P80 596.73.
- :
- Up: 1h close > 589 → 600.56–612.34
- Down: 1h close < 566 → 554.38–543.07
- : Support 566; Major support 566; Resistance 589; Major resistance 613.
- : Very low vol regime; σ24h 0.64%; Volatility regime supports muted price movements.
- : Cross-market risk-off signals align with bearish TA, yet a positive forecast persists due to model dynamics.
Drivers
- (contributions):
- SPREAD BP: +4.35
- LS TOP Z-SCORE: -1.85
- FNG VALUE: -1.83
- DEPTH USD 10BP LOG1P: +1.44
- STABLE MCAP LOG1P: -1.37
- SPREAD Z-SCORE: -1.12
- : Cross-market risk assets softened; stablecoin liquidity contracting; sentiment indicated as extreme fear (F&G: 15). BTC correlation remains high (0.84) over 72 hours, supporting a broad risk-off backdrop.
- : Taker flow balanced (16.6%); long positioning slightly crowded (1.70x).
ETF Flows (BTC/ETH)
Note: ETF data shown here pertains to BTC and ETH only. This context is provided for market context and is not a primary signal for BNB. BTC ETF: 1D -$82.2M; 5D -$73.4M; 10D +$178.1M. ETH ETF: 1D -$29.3M; 5D -$18.0M; 10D +$85.8M. The net effect of BTC/ETH ETF flows suggests a mixed to modestly cautious risk-off backdrop in the broader crypto market, which can influence altcoins through correlation channels but should not be treated as a primary signal for BNB trades.
What to Watch Next
- Monitor for a close above 589 to validate potential upside toward 600.56–612.34.
- Watch for a break below 566 to confirm downside continuation toward 554.38–543.07.
- Keep an eye on BTC/ETH ETF flow shifts as a contextual risk-off indicator; use only as secondary signal for market sentiment, not a direct driver for BNB trading decisions.
- Observe volatility regime and volume signals, as a sustained uptick in vol could precede larger moves despite current low volatility.
Hashtags: #BNB #CryptoMarket #TechnicalAnalysis #ETFFlows #BTC #ETH #Altcoins #MarketSnapshot #TradingStrategy #RiskManagement #Volatility #MarketContext