Market Snapshot
As of 2026-06-25, ADA sits near key support around 0.14 USD with resistance near 0.145 USD. The short-term bias from the latest model is bearish with a mid-range confidence level (≈62/100). The composite signal shows a negative tilt, though the forecast range implies potential for short-term upside if resistance at 0.145 is breached.
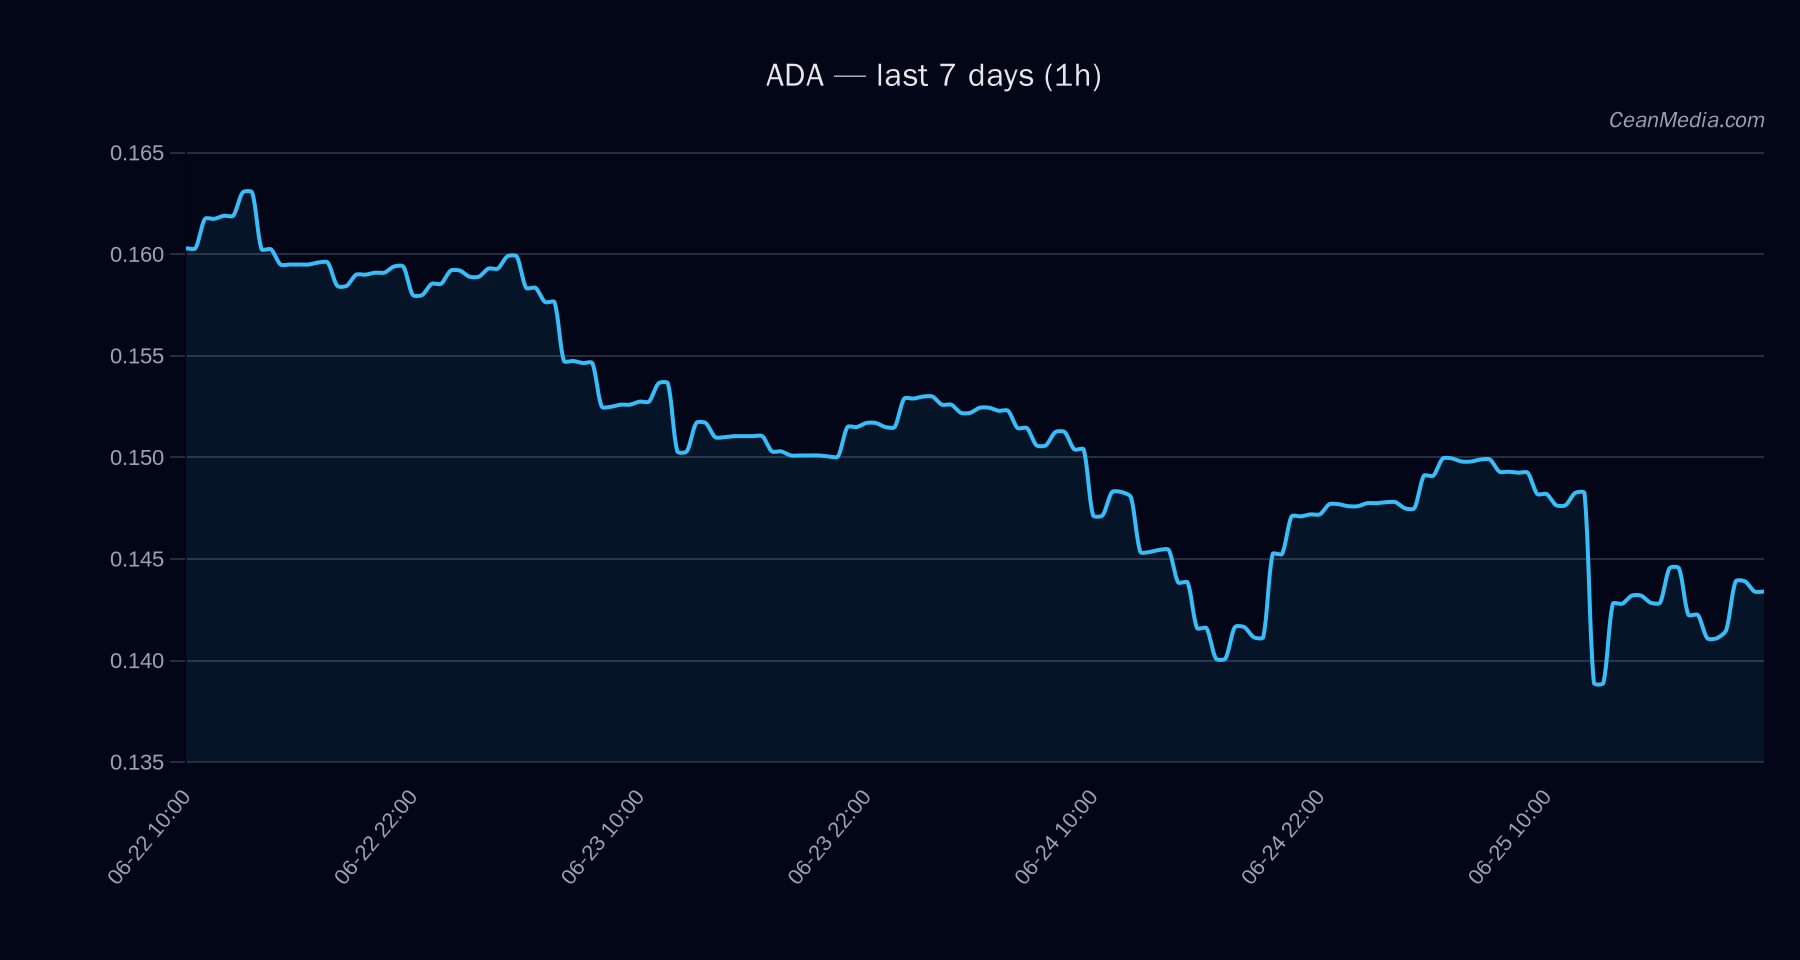
Technical Analysis: ADA
0.1434 EMA12 < EMA26; SMA50 < SMA200; RSI 45; Volatility regime: Low Up (46%), with Down 42%, Side 12% 0.1416 / 0.1377–0.1467 Support near 0.14; Major support at 0.15; Resistance near 0.145; Major resistance at 0.17
- Up: 1h close > 0.145 targets 0.1492 → 0.1521
- Down: 1h close < 0.14 targets 0.1377 → 0.1349
The TA reads ADA as currently bearish within a tight range, but with defined upside-trigger levels if near-term resistance is surpassed. RSI remains neutral at 45, indicating room for price action before overextension.
Drivers
DEPTH USD 10BP LOG1P (-3.45 value), SPREAD BP (12.4), LIQ IMB Z-SCORE (7.84), DRAWDOWN 30D (-3.18), LS TOP Z-SCORE (-2.12), RV 24H (3.34) Vol regime: Low; ATR: 0.0018; Breadth: 0% above SMA50; BTC correlation (72h): 0.90 Cross-market risk assets have softened; extreme fear in market sentiment (F&G: 12); Stablecoin liquidity contracting over 7D
Overall, the factor map points to modest negative structural pressure from macro signals and derivative flows, with some support from market depth and z-score metrics against the backdrop of low volatility.
ETF Flows (BTC/ETH)
Contextual note: ETF flow data presented here covers BTC and ETH only and is not a primary signal for ADA. It provides macro context on risk sentiment and capital allocation tendencies in the broader crypto market.
-$469.0M (1D), -$824.0M (5D), -$1.03B (10D) -$30.3M (1D), -$220.9M (5D), -$245.1M (10D)
Interpretation: The ETF data indicates a risk-off environment with persistent outflows from BTC and ETH over 1–10 days. While this context is not a direct signal for ADA, it aligns with the broader risk-off backdrop and could contribute to pressure on non-yielding or higher-beta assets within the market. Traders should treat these figures as context for risk appetite and liquidity conditions rather than direct ADA catalysts.
What to Watch Next
- Watch for a close above 0.145 to confirm breakout pressure toward 0.1492–0.1521.
- Monitor for a break below 0.14 to validate downside targets 0.1377–0.1349.
- Observe any shift in BTC/ETH ETF flows as a potential proxy for risk-on/risk-off sentiment affecting ADA liquidity and volatility.
- Keep an eye on RSI movement and volatility regime changes, which could precede larger price moves.
Hashtags: #ADA, #CryptoAnalysis, #TechnicalAnalysis, #ETFFlows, #BTC, #ETH, #MarketNews, #TradingStrategy, #RiskSentiment, #Altcoins, #CryptoMarkets, #PriceAction