
Market Snapshot
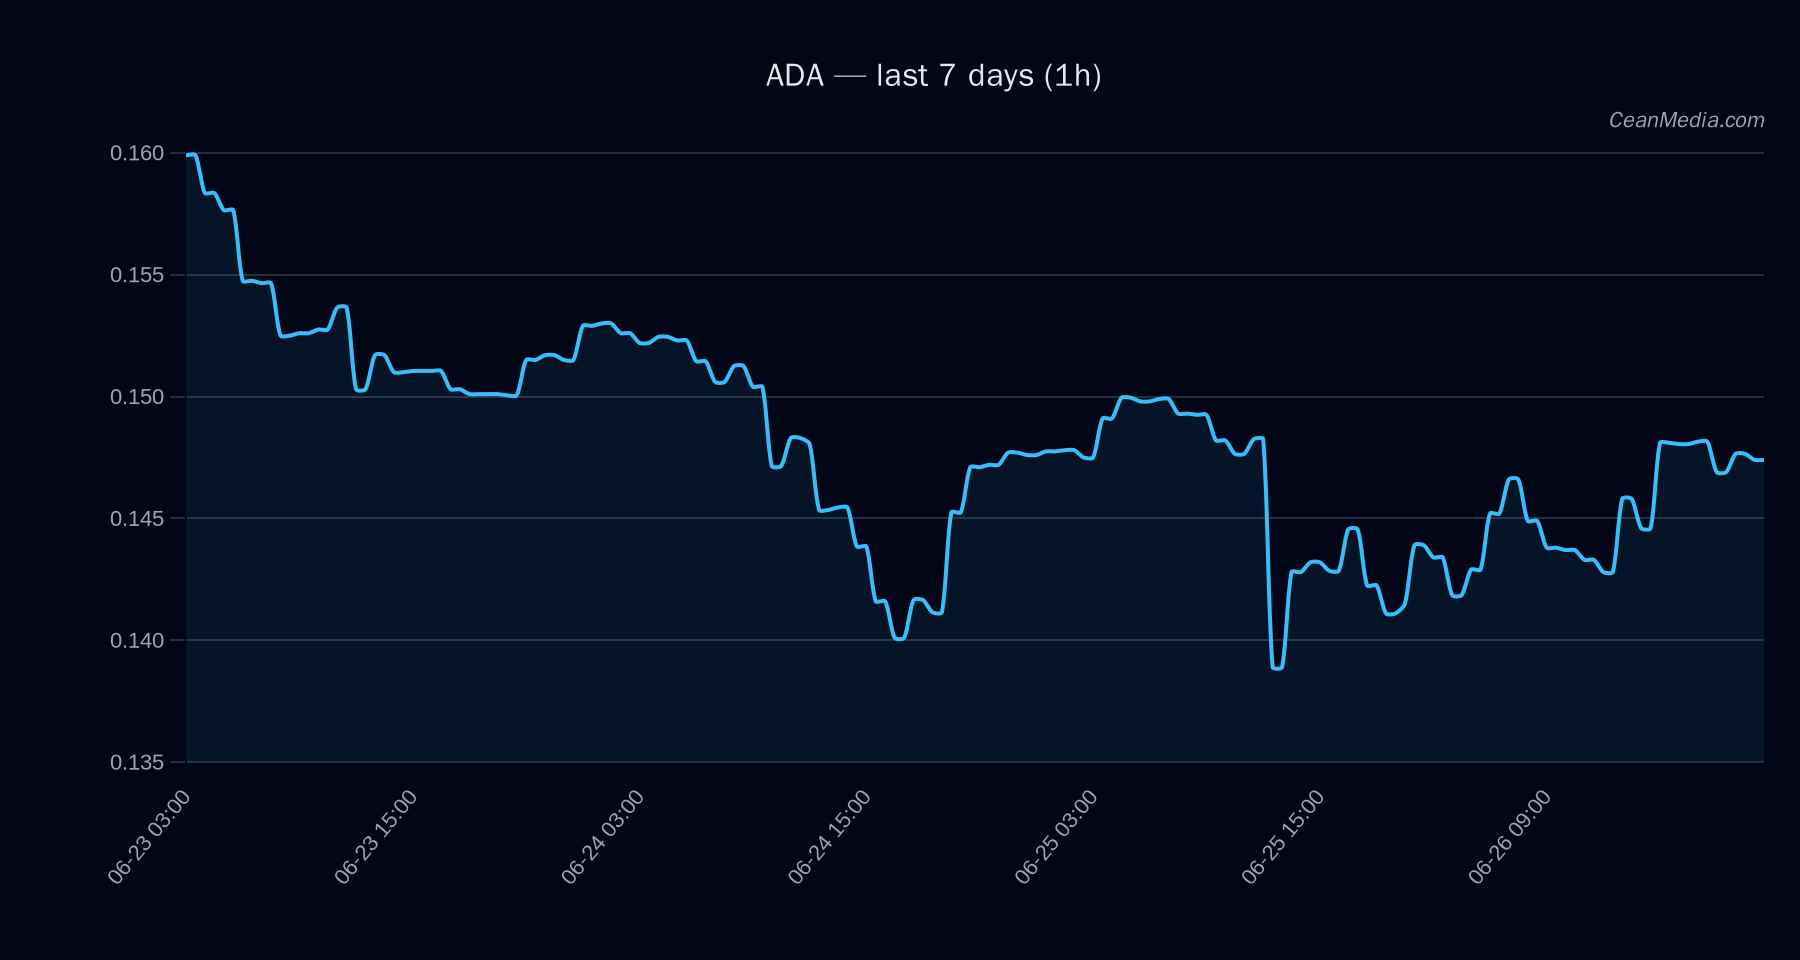
ADA trades in a mixed/neutral bias with a low certainty environment (5/100). The composite score is -0.3 with minimal data gaps (1%). The asset price sits around 0.1477, within a defined support-resistance band. Market breadth is roughly balanced (50% above SMA50), and BTC correlation over 72 hours remains high at 0.90, indicating systemic risk factors are influencing asset price behavior.
Technical Analysis: ADA
Current price: 0.1477
Trend and indicators: The TA trend is sideways while RSI sits at 56. Key layout: EMA12 > EMA26 and SMA50 < SMA200, noting a mixed trend signal within a range-bound environment. Volatility regime is Low (σ24h ≈ 1.05%), with ATR 0.0011 and vol unit 0.0013.
Forecast range: P50 0.1462; P20–P80: 0.1444–0.1515. Short-term triggers suggest a potential move beyond the price band if thresholds are crossed.
Levels: Support near 0.145, major support at 0.15; Resistance near 0.15, major resistance at 0.165.
Bias and scenario triggers: Bias is mixed/neutral with a low confidence level. Up-trigger: a 1-hour close above 0.15 targets 0.1537–0.1567. Down-trigger: a 1-hour close below 0.145 targets 0.1419–0.139.
Invalidation/confirmation: Breakouts above major resistance or below major support would reframe the posture; currently, no breakout confirmation beyond the stated levels.
Drivers
- Top model drivers include Depth USD 10BP log1p, Fundings Z-Score, Basis Z-Score, and BTC-related signals.
- Momentum/volatility: The model indicates a modest upside probability (~49%) with a notable impact from long-position crowding and short-term flow imbalances. BTC 24h return and BTC volatility regime contribute to constrained upside in a risk-off context.
: Tailwinds from cross-market risk-off signals are present but not overpowering; overall environment is low volatility with mixed directional signals for ADA.
ETF Flows (BTC/ETH)
Contextual note: ETF flow data presented here is limited to BTC and ETH ETFs and is not a primary signal for ADA. The BTC ETF shows outflows (1D: -$469M, 5D: -$824M, 10D: -$1.03B) and the ETH ETF also shows net outflows (1D: -$30.3M, 5D: -$220.9M, 10D: -$245.1M). These flows suggest a broader risk-off tone and liquidity preference shifts among large holders, potentially affecting correlated assets. However, ADA-specific implications should be interpreted with caution and in conjunction with asset-specific TA and microstructure signals.
What to Watch Next
- Watch for a sustained close above 0.15 to validate a move toward 0.1537–0.1567.
- Monitor for a break below 0.145 which could open a path toward 0.1419–0.139 in the near term.
- Assess changes in BTC/ETH ETF flows as a macro risk indicator and potential driver of cross-asset sentiment.
- Keep an eye on market breadth and volatility regimes to gauge whether ADA breaks out of the current sideways range.
Hashtags: #ADA #Cardano #CryptoAnalysis #CryptoMarkets #ETFFlows #MarketSnapshot #TechnicalAnalysis #RiskManagement #PriceAction #Liquidity #BTC #ETH