Market Snapshot
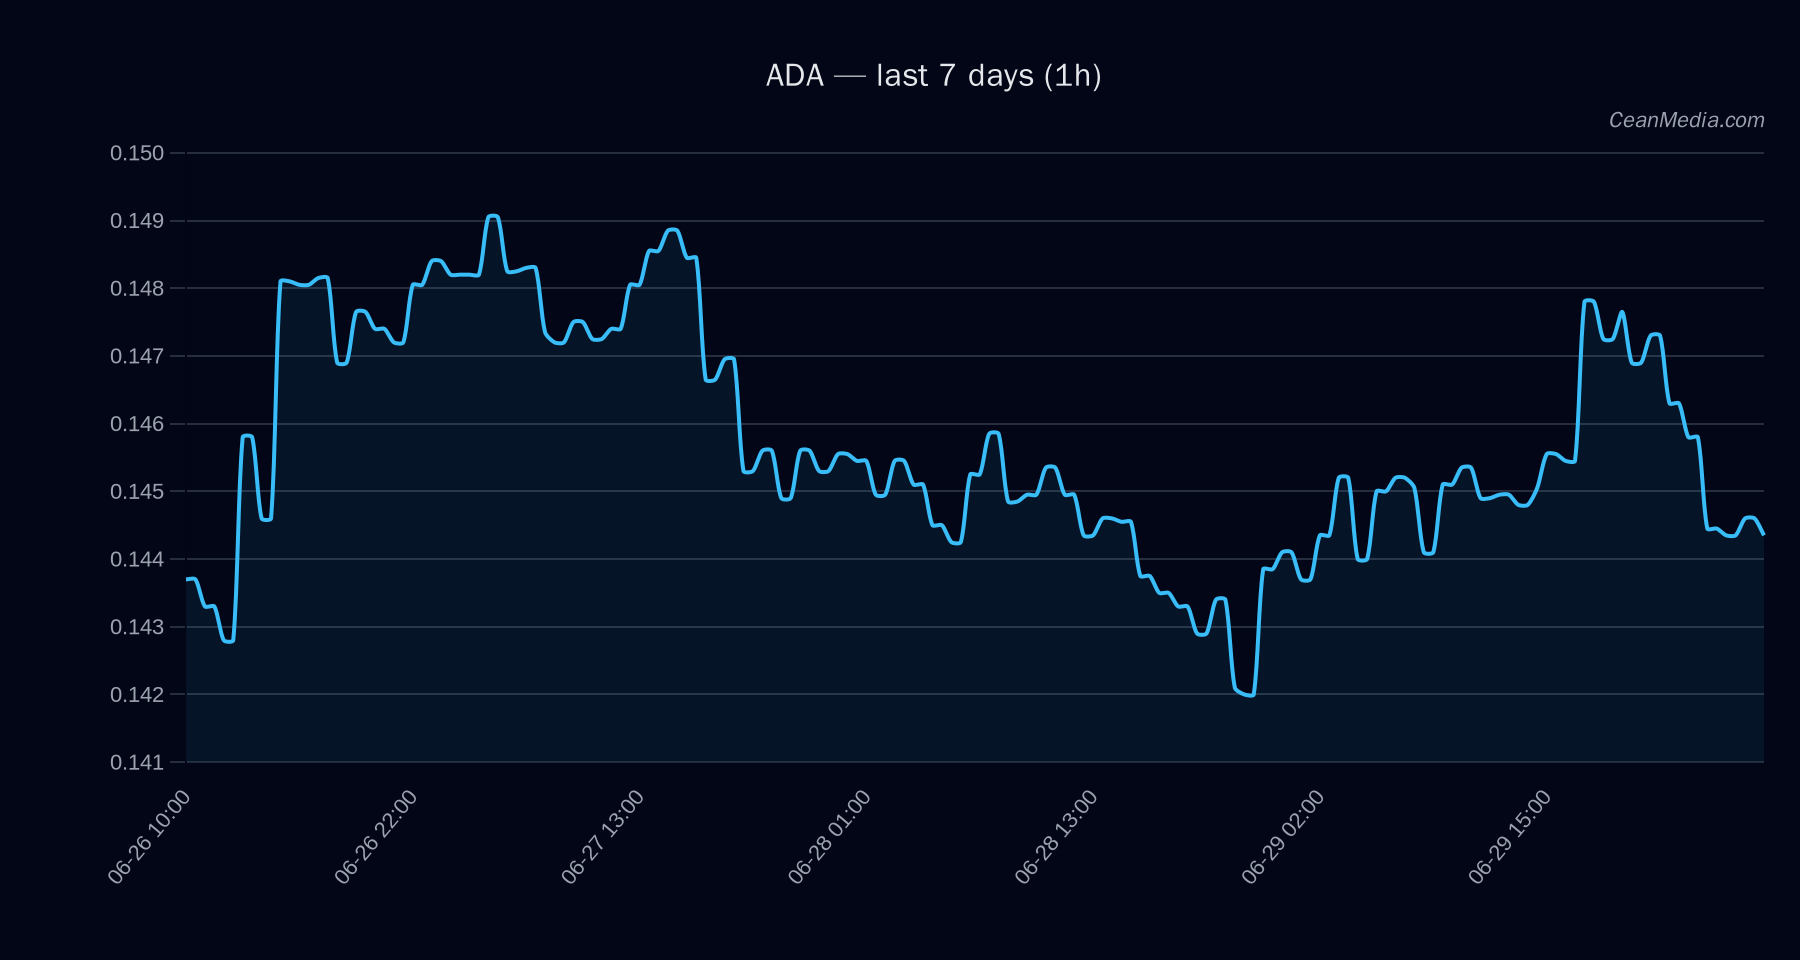
ADA has been probing resistance near 0.145 with a current price of 0.1444. The overall bias from the technical view is bearish with a medium certainty (55/100). The composite score stands at -4.7 with one conflicting signal. Market breadth is limited, and volatility is very low, suggesting a cautious stance as market participants await clearer directional triggers.
Technical Analysis: ADA
Current Price: 0.1444
Bias: Bearish (medium certainty, 55/100)
Trend: Sideways; RSI at 44. EMA12>EMA26 and SMA50 Forecast: Down (63% from model); 20% sideways; 29% up Key Levels Triggers Invalidation: Invalidation is implied by a sustained close beyond the defined levels with accompanying volume and improved breadth, particularly if price moves decisively through 0.16 or reclaims 0.145 with Vol regime signals supportive of a trend shift. Context: Breadth is modest (33% above SMA50), BTC correlation is 0.79 over 72h, and market sentiment is in extreme fear. 7-day stablecoin liquidity shows a contraction (-2.30B), which may dampen near-term upside.
Overall, the ADA forecast highlights continued downside pressure with constrained momentum in a low-volatility environment. The price range remains bounded by 0.14–0.145 in the near term, with a down bias unless a clean breakout occurs. Context: ETF flow data provided focuses on BTC and ETH. This information is contextual and not to be used as a primary signal for ADA. The latest reads show: Interpretation: The BTC side shows a modest intraday inflow against a backdrop of substantial medium-term outflows, while ETH ETF activity is clearly negative across 1D–10D horizons. Taken together, ETF flows suggest a cautious or risk-off tone affecting broader risk assets. This context can influence market sentiment but should not be treated as a primary signal for ADA moves. Hashtags: #ADA #Cardano #CryptoTechnicalAnalysis #MarketSnapshot #ETFFlows #BTC #ETH #RiskOn #Altcoins #TradingStrategy #PriceAction #Liquidity
Drivers
ETF Flows (BTC/ETH)
What to Watch Next