Market Snapshot
On 2026-07-04, LINK trades with a bullish bias in a low-volatility environment. The composite score remains positive, supported by a bullish TA setup and a risk-on market backdrop despite mixed macro signals. The instrument sits near a defined support and resistance band, with a near-term forecast skewed toward upside.
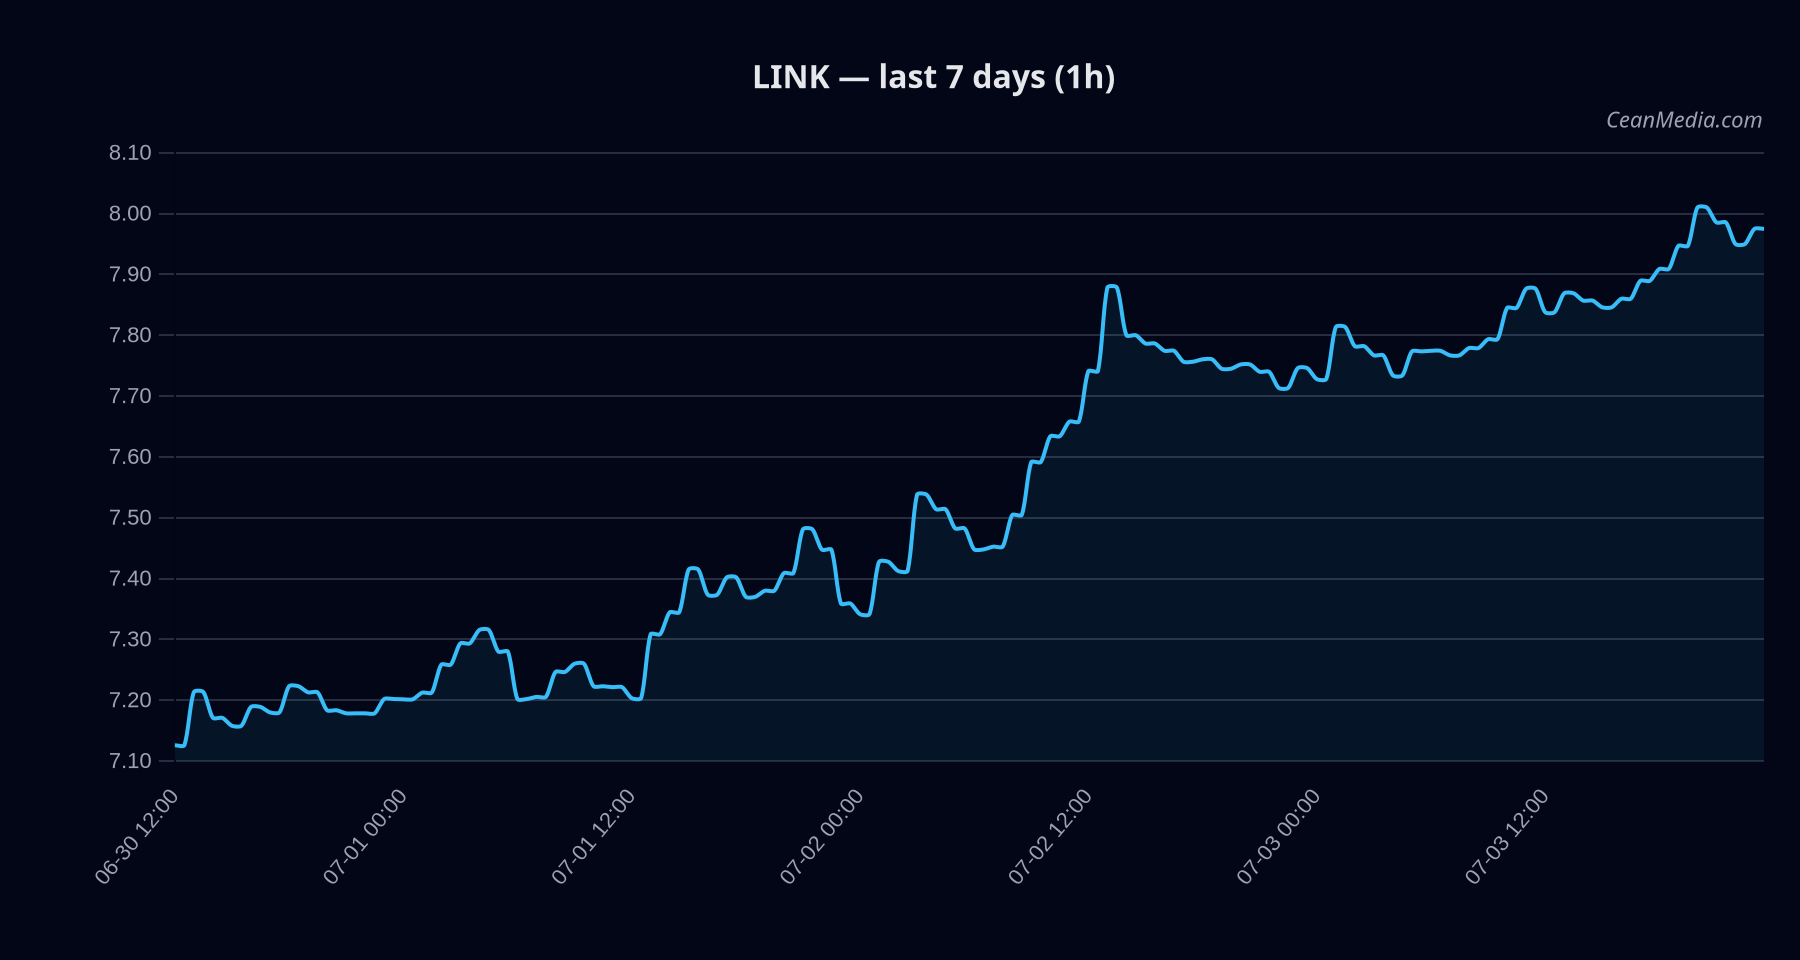
Technical Analysis: LINK
- Price: Close around 7.959
- Bias: Bullish (certainty medium, 47/100)
- Composite score: +4.1 with 1 conflict
- TA Trend: Bullish; EMA12>EMA26, SMA50>SMA200, RSI 66, volatility (σ24h) 0.41%, very low vol regime
- RSI: 66 (near-leaning bullish but not overbought)
- Forecast Range (P50): 7.8275
Forecast Range (P20-P80): 6.9449 – 9.0928
- Support: near 7.8; major 7.24
- Resistance: near 8.12; major 8.02
Triggers:
- Upside: 1h close > 8.12 ⇒ 8.2805 / 8.4429
- Downside: 1h close < 7.8 ⇒ 7.6438 / 7.4878
Invalidation / Notes: Data indicates some misalignment between signals; traders should await trigger confirmation before treating direction as high-conviction. Market breadth is strong above SMA50, BTC correlation high (0.86), and overall volume regime remains very low, suggesting cautious upside participation.
Drivers
: SPREAD BP, LS GLOBAL Z-SCORE, BTC DOMINANCE, LS TOP Z-SCORE, LS GLOBAL DELTA 24H, GOLD-SILVER RATIO Z-SCORE : Very low vol regime; RSIs in bullish territory; recent 24h return modest but positive : Broad risk assets supportive but macro signals mixed; sentiment data shows extreme fear (F&G: 22)
Overall, LINK’s TA is bullish in the near term with a low-volatility backdrop, and price action remains within a defined range, awaiting a breakout confirmation.
ETF Flows (BTC/ETH)
Contextual note: ETF flow data presented here applies only to BTC and ETH. This information should not be treated as a primary signal for LINK but provides situational context on market liquidity and risk appetite.
: 1D -$231.0M; 5D -$1.33B; 10D -$1.47B : 1D -$29.9M; 5D -$221.5M; 10D -$236.4M
Interpretation: The pattern shows sizable outflows from BTC ETFs over multiple horizons, with ETH also drifting negative over longer windows. This can reflect risk-off moves or reallocation within crypto assets. The data aligns with a cautious risk posture in the broader market, but LINK-specific signals remain driven by its own technicals and micro-structure factors rather than ETF flow alone.
What to Watch Next
- Watch for a close above 8.12 on any 1-hour interval to target 8.28–8.44.
- Monitor 7.8 as the near-term support; a break below could shift the scope toward 7.64–7.49.
- Keep an eye on volatility regime shifts and cross-asset risk indicators for potential regime change.
- Confirm whether the misalignment in evidence resolves with a clear trigger before treating the stance as high-conviction.
Hashtags: #LINK #CryptoMarkets #TechnicalAnalysis #BitcoinDominance #ETFFlows #BTC #ETH #MarketSnapshot #TradingView #CryptoNews #Altcoins
Note: ETF data included here is BTC/ETH-centric and intended for context; it should not be used as the sole signal for LINK trading decisions.