Market Snapshot
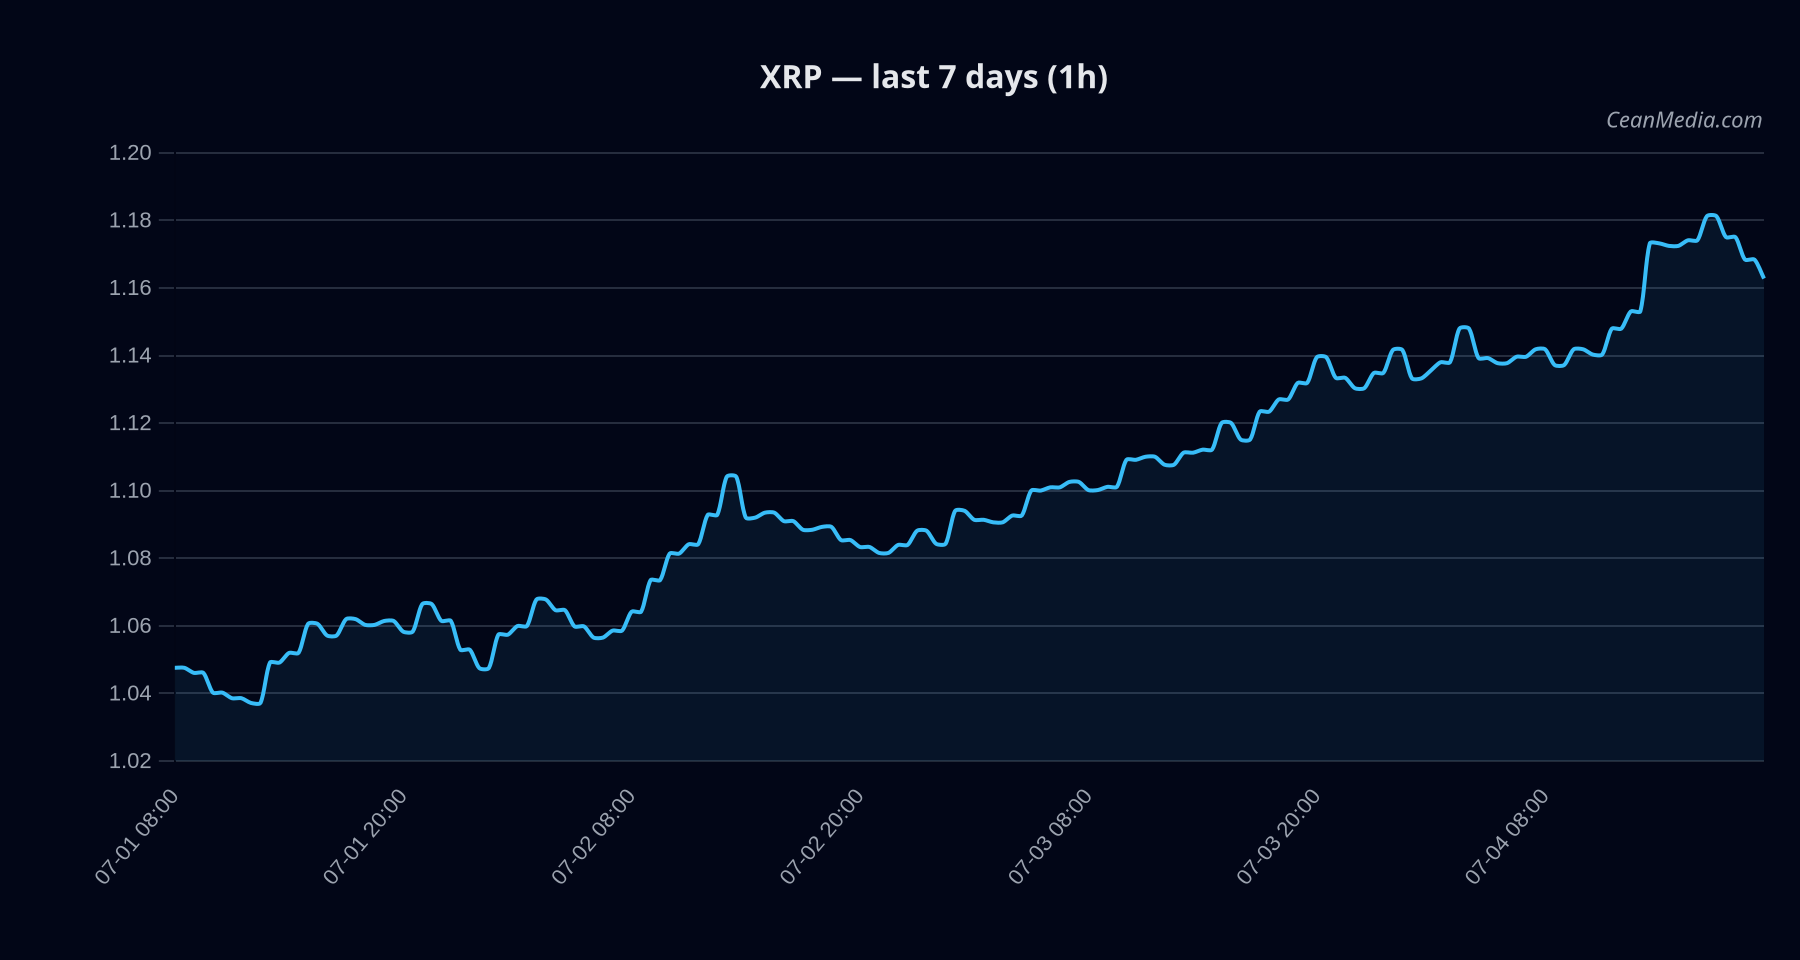
On 2026-07-04 XRP closed at 1.167. The current narrative shows a bullish tilt with a composite score of +2.6, though certainty remains moderate at 37/100. Market breadth is positive, with 100% of stocks above their 50-day average, and cross-asset conditions indicate risk assets are supportive. Bitcoin correlation over 72 hours stands at 0.67, underscoring proximal linkage to broader crypto-macro moves. Volatility regime is very low, and the intra-range dynamics between 1.14 (support) and 1.20 (resistance) guide near-term expectations.
Technical Analysis: XRP
EMA12 > EMA26, SMA50 > SMA200, RSI 64, ATR/σ24h 0.57%, Vol regime: Very low Down (49%), Up 44%, Side 7% - Support near: 1.14
- Major support: 1.06
- Resistance near: 1.20
- Major resistance: 1.14
- Upward trigger: 1h close above 1.20 → targets 1.2141 and 1.238
- Downward trigger: 1h close below 1.14 → targets 1.1208 and 1.0979
1.1467 / 1.0357–1.1942 No breakout beyond defined levels; inside-range conditions govern near-term probabilities.
Drivers
- FNG Z-SCORE: +1.91 (11.23)
- SPREAD BP: -1.54 (5.39)
- GOLD/SILVER RATIO Z-SCORE: +0.97 (0.91)
- DISTANCE FROM MA: +0.65 (1.63)
- CRYPTO STOCK BASKET RET 5D: +0.61 (0.70)
- DEPTH USD 10BP LOG1P: -0.59 (-1.86)
Breadth 100% above SMA50; BTC correlation 0.67; Fear/Greed index at 22 (Extreme Fear). 7-day funding/sentiment dynamics show stress in stablecoin liquidity and expectations for risk assets.
ETF Flows (BTC/ETH)
The ETF flows section covers BTC and ETH ETFs as external liquidity/context indicators. The data provided in this report is limited to BTC and ETH ETFs: BTC ETF shows net outflows of -$231.0M for 1D, -$1.33B for 5D, and -$1.47B for 10D; ETH ETF shows -$29.9M for 1D, -$221.5M for 5D, and -$236.4M for 10D. Notably, ETF flow data is contextual and not a primary signal for XRP. The broader implication is indicative of risk-off pressure or shifting asset allocation within crypto-equity products, rather than a direct XRP signal. In this context, persistent ETF outflows on BTC/ETH may accompany cautious risk sentiment in the near term but are not a conclusive driver for XRP’s price action.
What to Watch Next
- Watch for a daily close above 1.20 as a potential short-term bullish trigger to extend toward 1.238.
- Monitor a daily close below 1.14 as an invalidation signal increasing downside risk toward 1.1208 or 1.0979.
- Track changes in BTC/ETH ETF flows for shifts in risk sentiment, while maintaining XRP-focused TA as the primary signal.
- Observe volatility regime and narrative catalysts that could compress the XRP price range within 1.14–1.20 in the near term.
Hashtags: #XRP #CryptoAnalysis #TechnicalAnalysis #ETFFlows #MarketSnapshot #CryptoStrategy #BullishBias #RiskManagement #PriceAction #BTC #ETH