
Market Snapshot
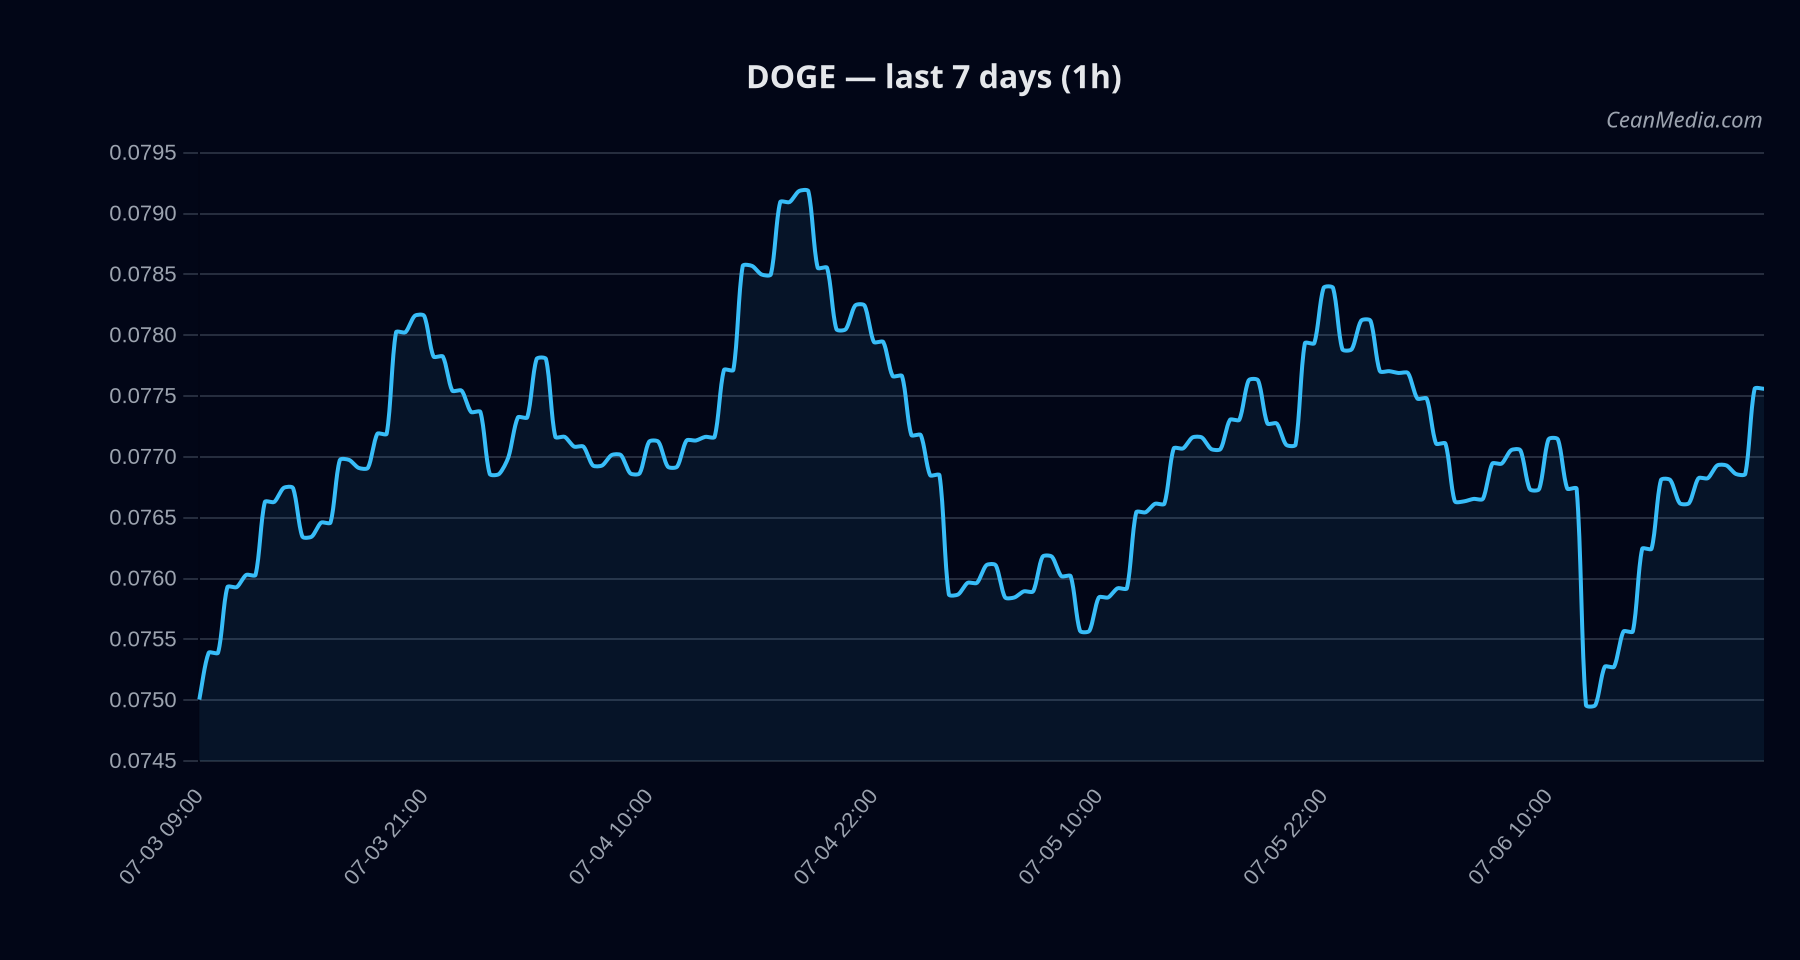
DOGE is trading near the 0.0770 level with a short-term range between 0.076 and 0.079. The Looming bias remains mixed/neutral with low certainty (5/100). The composite score is -0.7 with data quality flagged as incomplete (data missing ~40%) and snapshot age around 0.5 hours. Market breadth is favorable (83% above the 50-day moving average), and BTC dominance shows a modest rising trend over 7 days. The volatility regime is very low (ATR 0.0004, vol unit 0.0006).
Technical Analysis: DOGE
- Mixed/neutral with a sideways technical trend (RSI 54). Current EMA/MA configuration shows EMA12
SMA200. - Close around 0.0771. Forecast range (P50) at 0.0765 with a 20th-80th percentile band of 0.0708–0.0808. Key support near 0.076; major support at 0.073. Key resistance near 0.079; major resistance at 0.083.
- Upward trigger: close above 0.079 targets 0.0802–0.0818. Downward trigger: close below 0.076 targets 0.0741–0.0725.
- If price closes outside the defined 0.076–0.079 band without a clear follow-through, re-evaluate the bias due to low data quality and mixed signals.
- Model forecast leans down (52%), with sideways TA signal. RSI remains neutral around mid-range, not signaling oversold or overbought conditions.
Drivers
- SPREAD BP, FNG Z-SCORE, BTC DOMINANCE, STABLE MCAP LOG1P, LS TOP Z-SCORE, BTC VOL REGIME.
- Vol regime is very low; breadth is robust (83% above SMA50), while price distance from MA is modest (distance_from_ma ~0.0122). The BTC dominance signal is positive over 7 days, with BTC 24h return around 2.2%.
- Stablecoin liquidity shows contraction in the 7D window; sentiment remains in extreme fear, contributing to cautious positioning in alt assets like DOGE.
ETF Flows (BTC/ETH)
Note: ETF flow data provided pertains to BTC and ETH only and should be interpreted as contextual market liquidity signals, not primary DOGE directional signals. BTC ETFs show notable outflows across 1D, 5D, and 10D horizons (e.g., -$231.0M 1D, -$1.33B 5D, -$1.47B 10D). ETH ETFs also show net negative flow (1D: -$29.9M, 5D: -$221.5M, 10D: -$236.4M). These flows imply macro risk-off or reallocation pressures in large-cap crypto markets, which can influence DOGE through correlated liquidity dynamics rather than direct DOGE signals.
What to Watch Next
- Monitor 1h close around 0.079 for potential breakout to 0.0802–0.0818 if breached.
- Watch for a break below 0.076 to confirm further downside toward 0.0741–0.0725, keeping in mind the low data quality and sideways TA bias.
- Assess BTC dominance and overall market liquidity, as declines in BTC/ETH ETF flows may translate into reduced risk appetite for altcoins.
- Stay aware of any shifts in stablecoin liquidity and market sentiment, which could alter DOGE risk premium in the near term.
Hashtags: #doge #cryptoanalysis #marketview #technicalanalysis #ETFflows #BTC #ETH #cryptomarket #tradingview #riskmanagement #liquidity
Note: ETF data provided here is for context and does not replace DOGE-specific TA signals.