
Market Snapshot
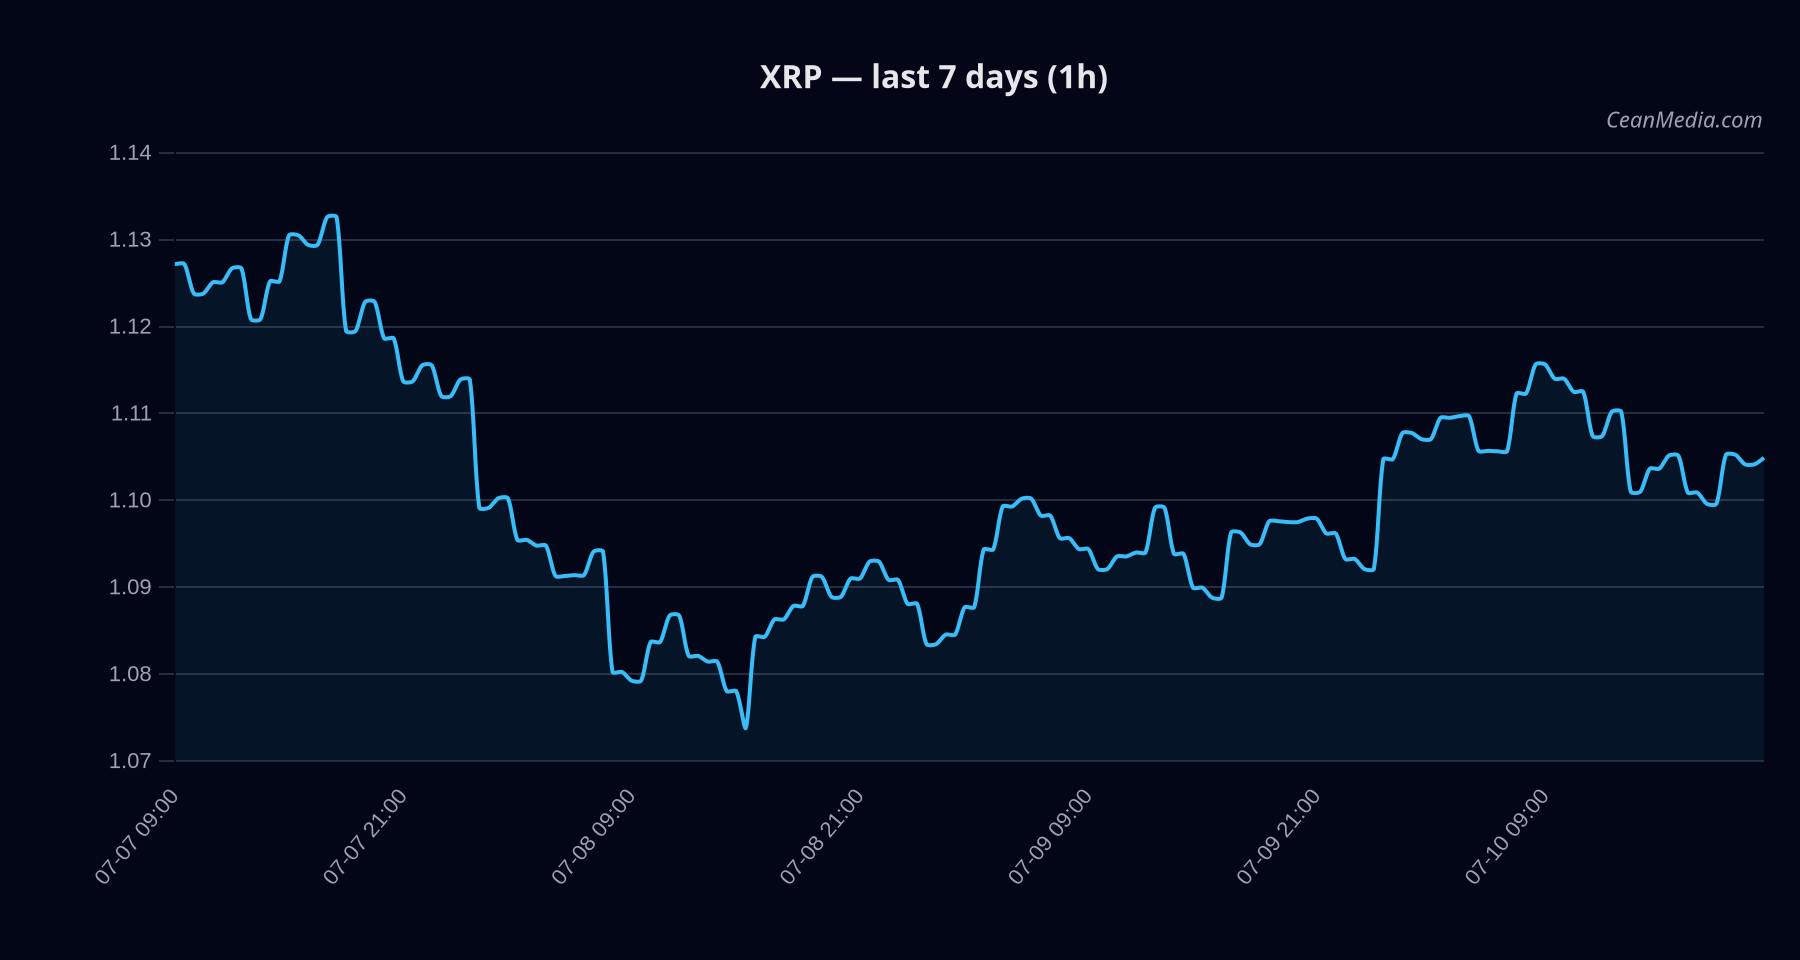
As of 2026-07-10, XRP trades around 1.10, with a bias described as mixed to bearish pressure and low certainty (5/100). The composite score is negative (-1.1) amid conflicting indicators. Market breadth remains supportive, BTC correlation remains high, and volatility is very low in the current regime.
Technical Analysis: XRP
1.1037 -1.1; conflicts 1 EMA12 > EMA26, SMA50 < SMA200, RSI 50; volatility (σ24h) 0.39% 1.1074;
P20-P80: 1.0532 – 1.1179FNG Z-Score, SPREAD BP, Depth USD 10bp, Gold/Silver ratio metrics
Overall, XRP is range-bound near support/resistance with a potential downside bias if the break below 1.08 executes. The forecast probability leans slightly toward downside (50.2%) with a 38.7% chance of upside movement, and a 11.1% chance of sideways movement.
Drivers
FNG Z-Score (positive contribution), SPREAD BP (negative), Depth USD 10bp (negative) Very low vol regime; EMA slope near flat; 24h return modest Cross-market risk assets supportive; sentiment shows extreme fear; BTC dominance trending higher
ETF Flows (BTC/ETH)
Contextual note: ETF flow data provided pertains solely to BTC and ETH and is included to gauge broader risk sentiment and market participation. It is not used as a primary signal for XRP price action. In the latest observation, BTC ETFs show net outflows (1D: -$84.9M; 5D: -$963.7M; 10D: -$1.31B), while ETH ETFs display net inflows (1D: +$70.5M; 5D: +$18.2M; 10D: -$162.8M). This pattern can reflect shifting risk appetite and relative rotation between assets, not a direct XRP driver.
1D -$84.9M; 5D -$963.7M; 10D -$1.31B 1D +$70.5M; 5D +$18.2M; 10D -$162.8M
What to Watch Next
- Watch for a close above 1.12 on a 1-hour window as a potential bullish trigger toward 1.1483–1.1708.
- Monitor a break below 1.08 on a 1-hour close for downside targets near 1.06–1.0384.
- Observe shifts in BTC dominance and overall risk appetite, as BTC/ETH ETF flows suggest rotating risk. While not XRP signals, they contextualize market mood.
- Keep an eye on macro and cross-asset correlations, given the high BTC correlation and low volatility regime.
Hashtags: XRP, crypto, market-analysis, ETF-flows, BTC-dominance, risk-sentiment, technical-analysis, price-action, range-trading, volatility