
Market Snapshot
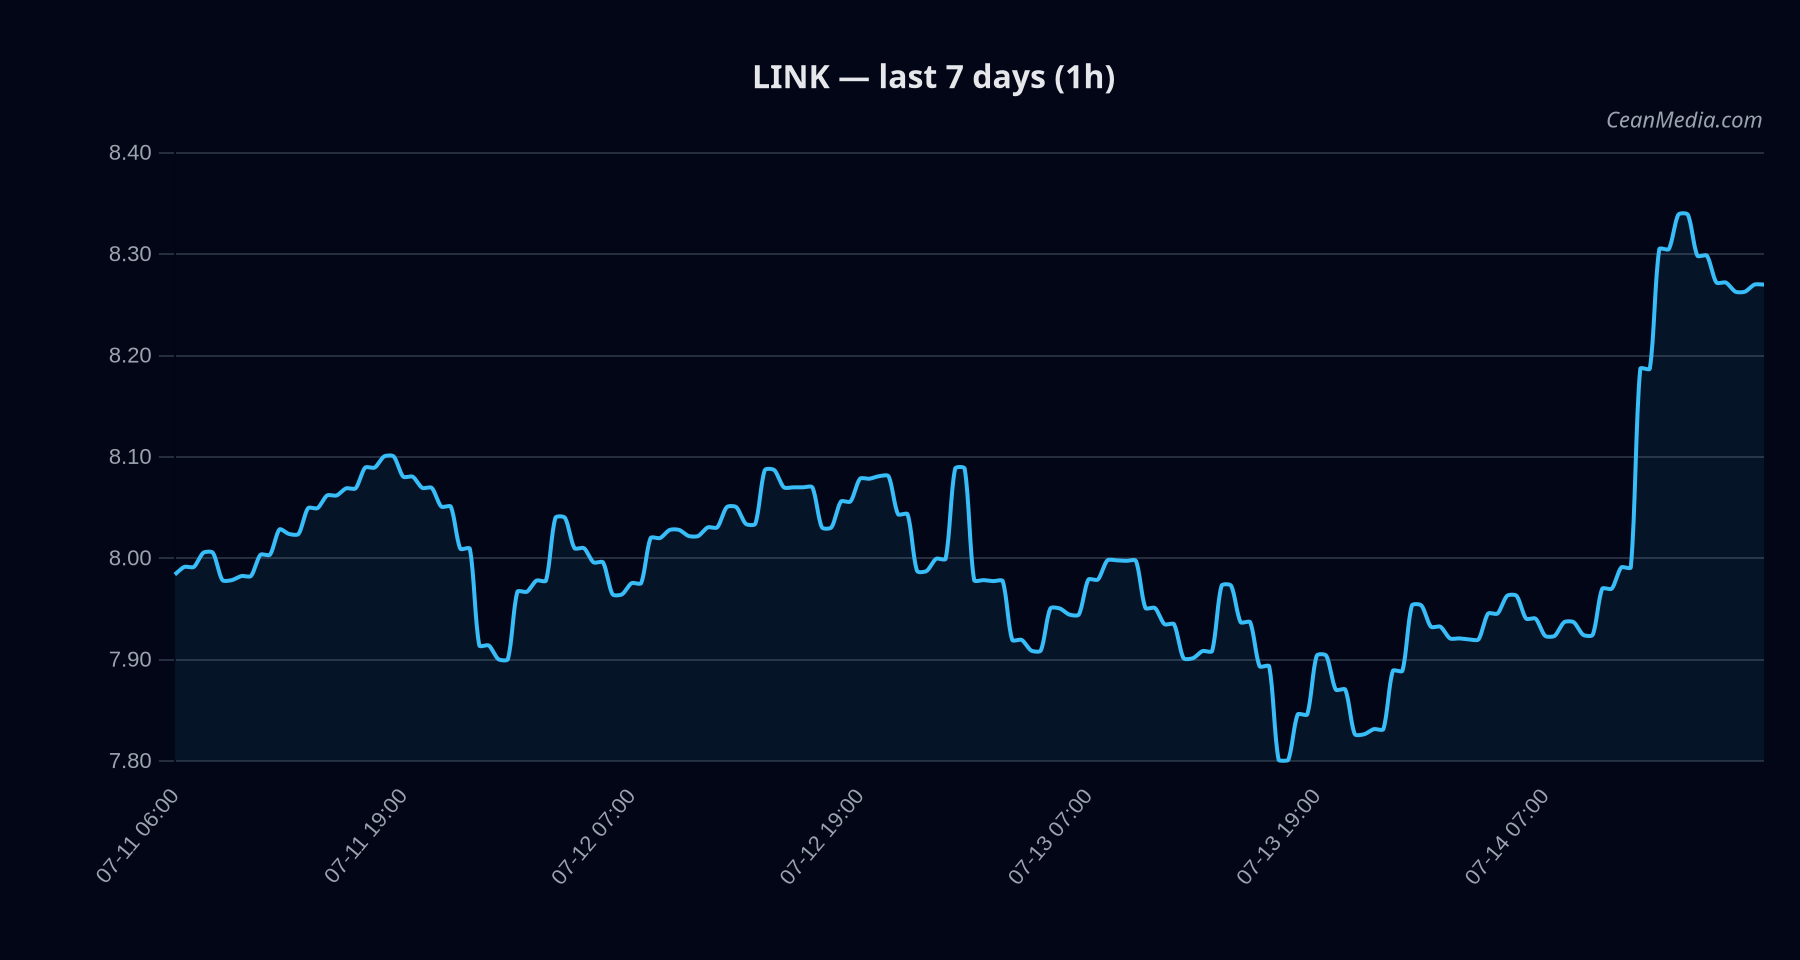
As of 2026-07-14, LINK trades near 8.29 with a bullish tilt in the near term. The composite score sits at +2.8 with low certainty (40/100). Market breadth is strong (100% above SMA50) and BTC dominance shows a mild upward bias over 7 days. The current volatility regime is very low (σ24h ~ 0.66%, ATR 0.0429).
Technical Analysis: LINK
- bullish
- 71 (overbought territory)
- EMA12 > EMA26; SMA50 > SMA200
- Close 8.29
- 8.1459
Levels
- Support: near 8.12; major 7.5
- Resistance: near 8.46; major 8.04
Triggers
- Up: 1h close > 8.46 → potential targets 8.6249 and 8.794
- Down: 1h close < 8.12 → potential targets 7.9617 and 7.7992
Invalidation/Context: Despite a bullish TA setup, RSI is in overbought territory; use trigger levels for confirmation and monitor breadth and cross-market signals. The model forecast assigns 47% probability to an upward move within 24 hours, with risk-on signals tempered by cross-market softness and extreme fear sentiment in broader markets.
Drivers
- Return 24h: 0.054
- EMA Slope: 0.0022
- Funding Z-Score: 1.636
- Basis Z-Score: 0.501
- OBI EMA5: 0.0216
- BTC Return 24h: 0.0412
Vol regime: Very low; 24h price volatility remains subdued, contributing to a narrow forecast range. BTC dominance up modestly over 7 days; overall risk-off sentiment (F&G: 22) aligns with cautious upside expectations in LINK.
ETF Flows (BTC/ETH)
Note: ETF flow data presented here is limited to BTC and ETH ETFs. This information provides market context but is not a primary signal for LINK. Historical ETF inflows/outflows can influence risk sentiment and liquidity in correlated markets.
1D -$95.3M; 5D -$590.0M; 10D -$1.41B 1D -$52.2M; 5D -$3.7M; 10D -$224.6M
Interpretation: Persistent BTC ETF outflows in the near term may reflect risk-off behavior, while ETH-related flows show mixed signals. The context from BTC/ETH ETF activity suggests caution on broader risk appetite, which can influence LINK indirectly through market sentiment and liquidity conditions rather than serving as a direct signal for LINK price movement.
What to Watch Next
- Monitor 1h close relative to 8.46 resistance for potential breakout continuation toward 8.6249–8.794 if triggered.
- Observe 1h close below 8.12 to assess downside risk toward 7.9617–7.7992.
- Watch breadth and BTC dominance trends for signs of shifting risk sentiment that could impact LINK momentum.
- Keep an eye on volatility regime: a shift from very low to higher volatility could widen the forecast band and alter risk-reward dynamics.
Hashtags: #LINK #CryptoMarket #TechnicalAnalysis #ETFFlows #BTC #ETH #MarketSnapshot #Liquidity #RiskOn #RiskOff #Altcoin #TradingStrategy