
Market Snapshot
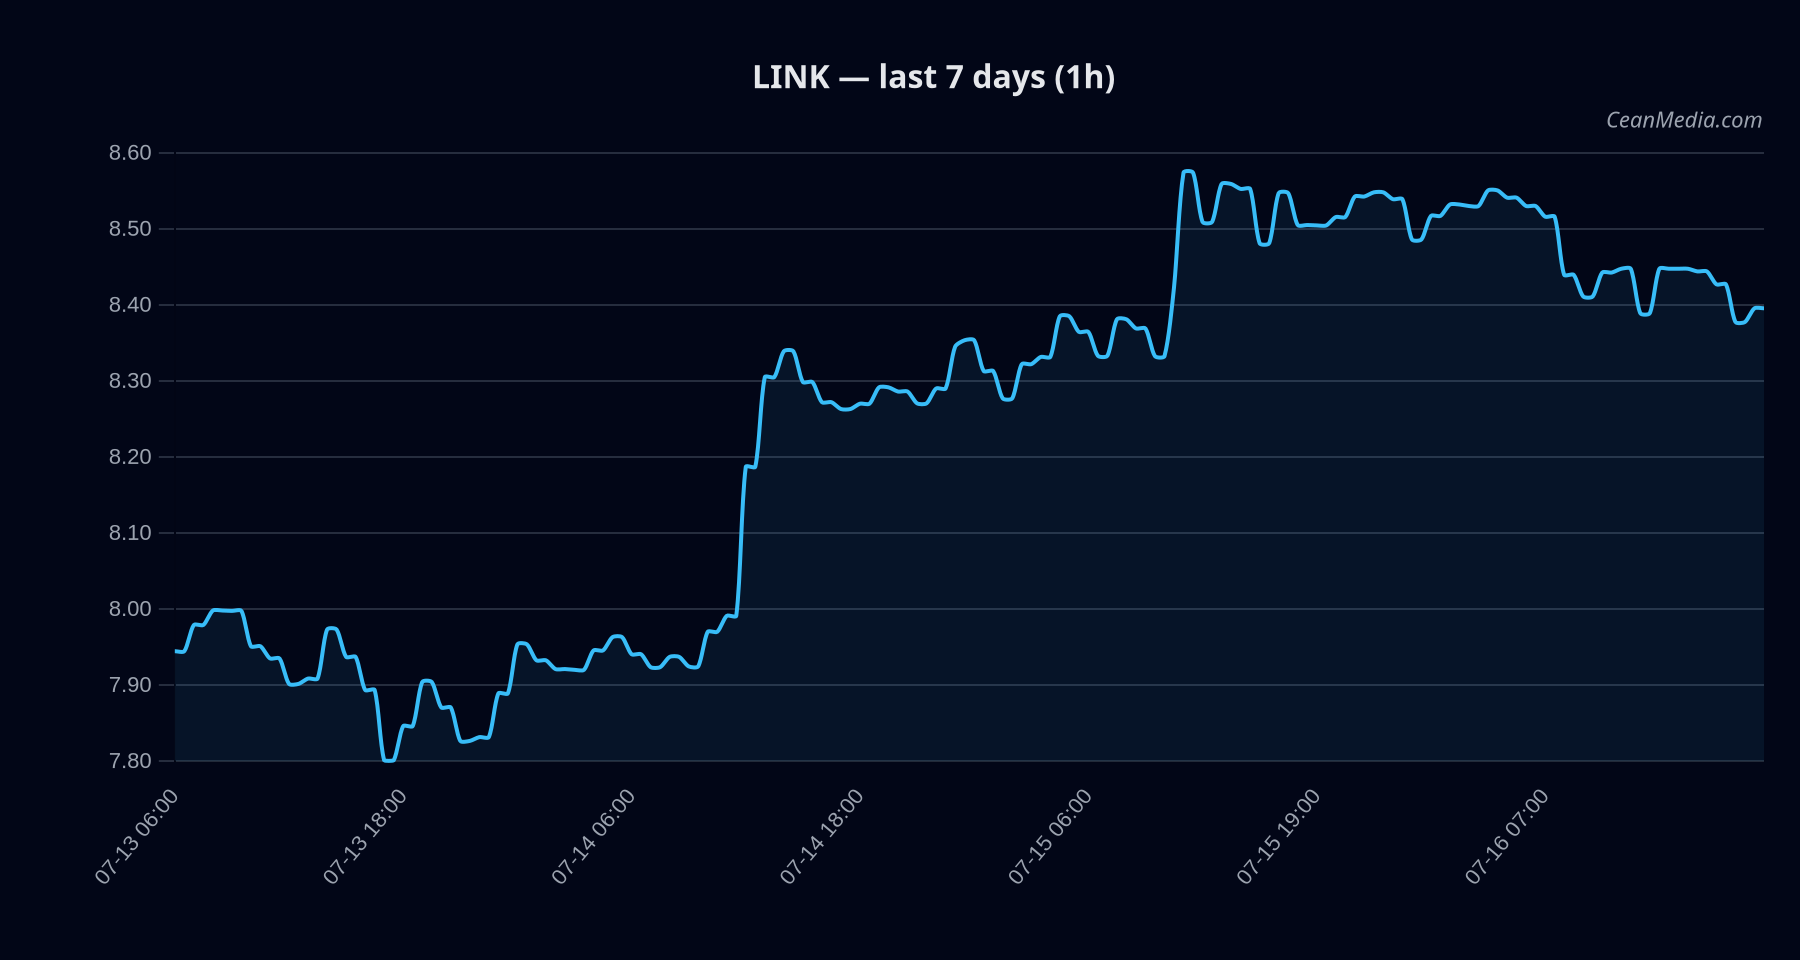
As of the latest data, Chainlink (LINK) shows a slightly bearish bias with low confidence (certainty 26/100). The composite score is -1.8 with no conflicts noted. The price sits at 8.397, within a tight range in a very-low volatility regime.
Short-term momentum indicators reflect a sideways technical trend with RSI at 44, suggesting neither overbought nor oversold conditions. The market context shows extreme fear in sentiment metrics and contracting stablecoin liquidity, with overall breadth around the 0% mark above the 50-day moving average.
Technical Analysis: LINK
Sideways (RSI 44; EMA12 < EMA26; SMA50 > SMA200; vol regime: very low) 8.397 - Support: near 8.22
- Major support: 7.6
- Resistance: near 8.56
- Major resistance: 8.34
- Upward break: 1h close > 8.56 → target 8.7362 / 8.9075
- Downward break: 1h close < 8.22 → target 8.0645 / 7.8999
Drivers
GOLD/SILVER ratio, SPREAD BP, BTC dominance, FNG Z-score, VIX Z-score Very low volatility; vol-of-vol and breadth are muted, with extreme fear sentiment (F&G 25). Cross-market risk assets supportive but stablecoin liquidity contracting. 0.75% above/below (approximately 0.0075 in model distance metric)
ETF Flows (BTC/ETH)
Context: ETF flow data provided is limited to BTC and ETH and serves as a market sentiment backdrop rather than a direct signal for LINK. Current data indicate net outflows for BTC ETFs (-$424.7M today, -$570.2M over 5D, -$1.76B over 10D) and small to moderate outflows for ETH ETFs (-$15.4M today, -$6.3M over 5D, -$210.7M over 10D). This pattern suggests a risk-off tilt in the broader crypto space, which may influence LINK indirectly through macro risk appetite but should not be treated as a primary signal for LINK pricing.
- BTC ETF flows: -$424.7M (1D); -$570.2M (5D); -$1.76B (10D)
- ETH ETF flows: -$15.4M (1D); -$6.3M (5D); -$210.7M (10D)
What to Watch Next
- Watch for a close above 8.56 on a 1h or higher timeframe to confirm bullish trigger toward 8.7362–8.9075.
- Monitor if price breaks below 8.22 to validate downside targets around 8.0645–7.8999.
- Stay aware of shifts in BTC/ETH ETF flows as a contextual risk signal for broader market liquidity and sentiment.
- Keep an eye on volatility regime; very low vol can precede sharper moves if a trigger is hit.
Hashtags: #LinkAnalysis #CryptoMarket #TechnicalAnalysis #LINKUSD #BTCETF #ETHETF #MarketSnapshot #CryptoFlows #WTI #AltMarkets #RiskManagement