
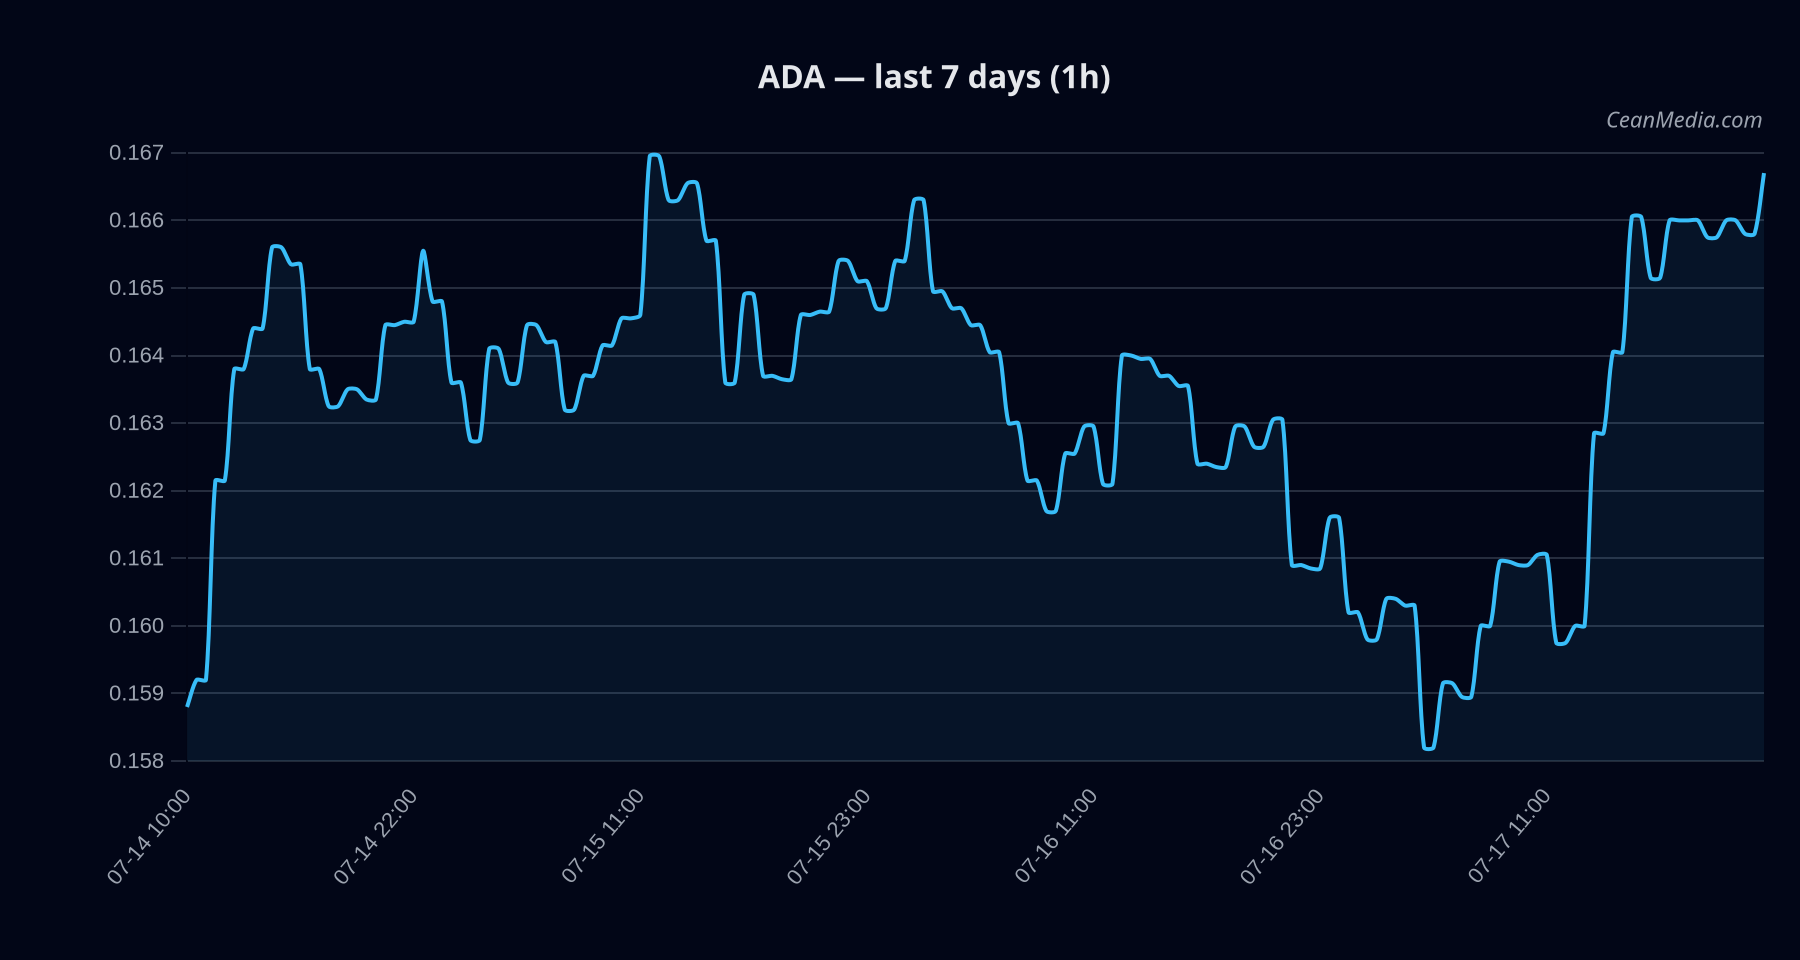
Market Snapshot
Cardano (ADA) is hovering near a short-term support zone with a measured bias described as mixed to bearish pressure. The current close sits around 0.1672 USD, within a narrow trading range defined by the near-term support around 0.165 and resistance near 0.17, with a broader major resistance around 0.185. The market context shows very low volatility and a risk-off backdrop across broader markets, with BTC dominance mildly increasing over 7 days.
Technical Analysis: ADA
- Bias: mixed / bearish pressure; certainty low (24/100).
- Composite score: -2.5; note that evidence is not fully aligned and trigger confirmation is advised before treating direction as high-conviction.
- Close price: 0.1672 USD.
- Forecast model: down (53%); Up 38% | Side 9% | Down 53%.
- TA trend: sideways; RSI 68. EMA12>EMA26; SMA50
- Level map: Inside range with no breakout confirmation. Break above 0.17 targets 0.174–0.1774; break below 0.165 targets 0.1606–0.1573.
- Key levels: Support near 0.165; major support at 0.16. Resistance near 0.17; major resistance at 0.185.
- Forecast range (P50): 0.1646; range (P20–P80): 0.1563–0.1813.
- Top drivers (select): Return 24h: 0.04; EMA slope: 0.0021; Funding Z-Score: 0.73; Basis Z-Score: 2.27; Order-book Imbalance (EMA5): 0.0336; BTC return 24h: 0.0016.
Drivers
- Top model drivers include high relief from basis Z-score and modest EMA slope contributions, with funding dynamics indicating continued caution among traders.
- Momentum/volatility factors show very low volatility (vol regime: Very low) and a calm breadth reading (33% above SMA50).
- Context includes cross-market risk-off sentiment and a BTC dominance uptrend, which can influence Altcoins through correlated flows.
ETF Flows (BTC/ETH)
ETF flow data provided refers exclusively to BTC and ETH instruments and should be interpreted as contextual market breadth rather than a primary signal for ADA pricing. The data show:
- BTC ETF: +$15.0M on 1D; -$324.2M on 5D; -$1.65B on 10D.
- ETH ETF: -$16.8M on 1D; +$6.8M on 5D; -$214.7M on 10D.
The net signal from BTC/ETH ETF flows over these windows suggests a mixed risk-on/off tone with recent near-term episodic inflows for BTC but negative longer-dated flows; ETH shows a modest 5-day positive but a larger recent draw. It is important to emphasize that ETF data are exogenous to ADA and should be treated as contextual risk indicators rather than driving factors for ADA price action.
What to Watch Next
- Monitor for a breakout above 0.17 to validate a potential push toward 0.174–0.1774.
- Watch for a move below 0.165 to confirm a shift toward 0.1606–0.1573.
- Keep an eye on BTC dominance and systemic risk appetite, as the ETF flows context suggests a still-fragile risk-on/off environment.
- Look for confirmation from intraday closes and triggering events rather than relying on single-bar signals due to the current low-volatility regime.
Hashtags: #ADA #Cardano #CryptoMarkets #TechnicalAnalysis #ETFFlows #BTC #ETH #MarketOutlook #CryptoRisk #Altcoins #PriceAction #TradingStrategy