
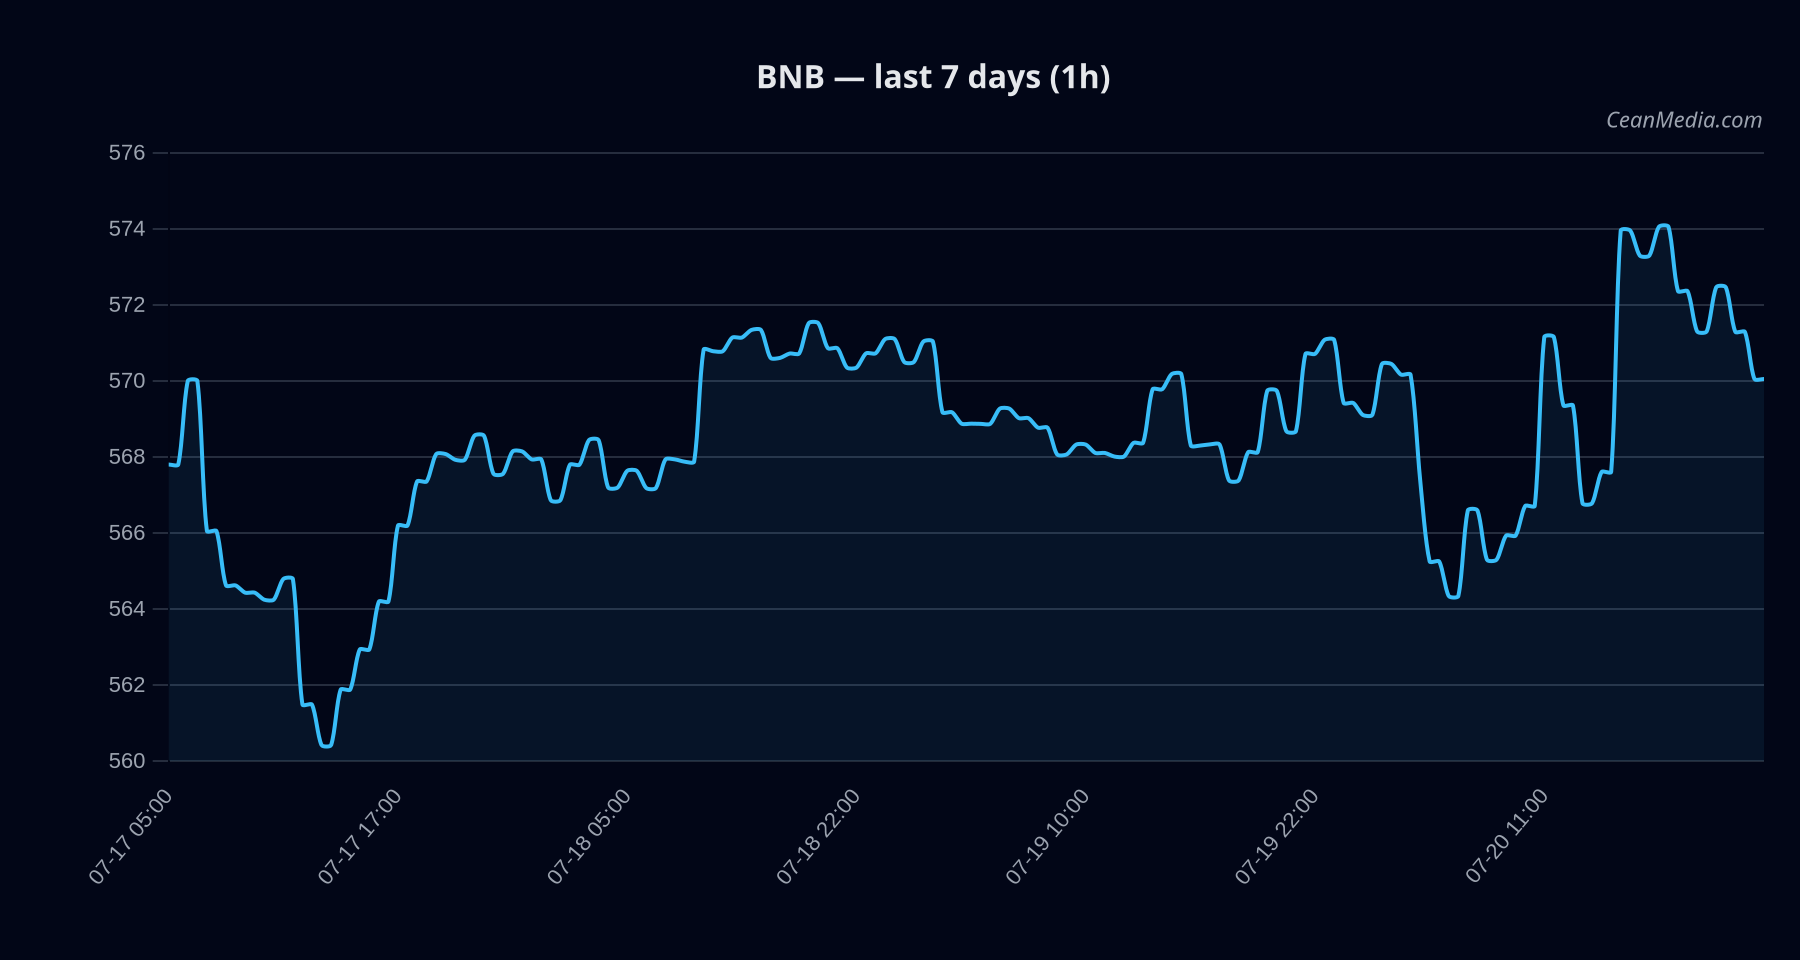
Market Snapshot
As of 2026-07-20, BNB sits between the near-term support at 560 and the resistance around 583. The price closed at 571.27, within an inside-range setup. Market breadth remains strong, with 100% of equities above the 50-day moving average and BTC dominance trending higher over a 7-day window. Overall risk sentiment shows Fear in the market (F&G: 29).
Technical Analysis: BNB
+0.1, with zero conflicts reported. 570.89; range 552.42 – 583.31 (P20–P80). 560 / 567 583 / 582 - Up: 1h close > 583 → 594.35 / 606.00
- Down: 1h close < 560 → 548.65 / 537.45
Drivers
SPREAD BP, STABLE MCAP LOG1P, GOLD/SILVER RATIO Z-SCORE, FNG Z-SCORE, RV 7D, LS TOP Z-SCORE. Very low vol regime; breadth strong (>50h, 100% above SMA50). Taker flow is balanced; long crowding at approximately 1.68x. Cross-market risk assets supportive; BTC dominance trending up (0.56 over 7D).
ETF Flows (BTC/ETH)
ETF flow data is provided for BTC and ETH only and should be treated as context rather than a primary signal for BNB. Current observations show BTC ETFs recording a net positive inflow of +$132.3M for 1D, with sustained outflows over 5D and 10D horizons. ETH ETFs show +$36.7M 1D, +$11.6M 5D, and -$123.1M 10D. These figures suggest appetite for BTC exposure in the near term, potentially reflecting broader risk-on sentiment or hedging activity that may influence correlated assets, but they are not a direct signal for BNB leadership or moves.
What to Watch Next
- Monitor 1h close relative to the 583 resistance to confirm upside trigger momentum.
- Watch for a daily close beyond 560 to validate downside protection or signals of renewed selling pressure.
- Assess BTC dominance and BTC ETF flow trajectory as contextual risk indicators for cross-asset correlations.
- Maintain awareness of volatility regime shifts; a move from very low to higher vol could reweight risk premia and price action across the ecosystem.
Hashtags: #BNB #CryptoTechnicals #MarketAnalysis #ETFFlows #BTC #ETH #CapitalMarkets #MarketContext #PriceAction #RiskOn #Altcoins #CryptoNews