
Market Snapshot
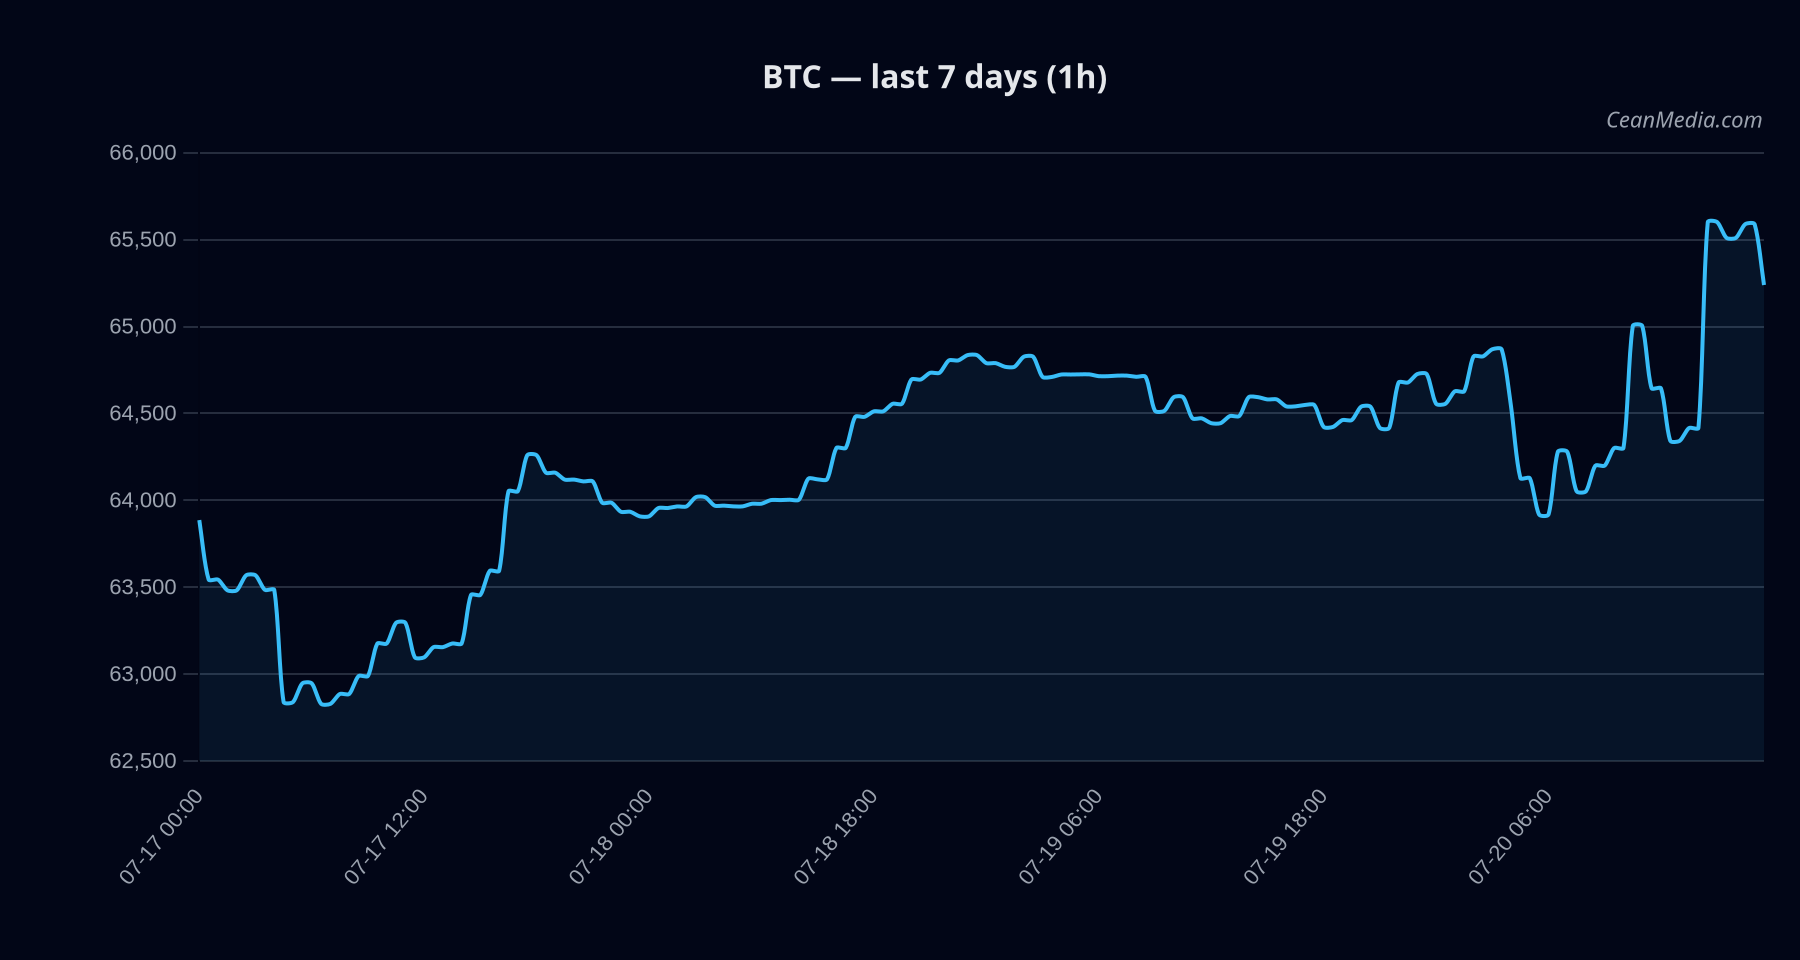
As of 2026-07-20 to 2026-07-21, BTC sits in a bullish bias with a composite score of +3.1 and 44/100 certainty. The snapshot shows a close near 65,210, with a P50 forecast around 65,745 and a range spanning roughly 62,309 to 66,420. Market breadth is strong (100% above SMA50), and BTC/USD exhibits very low volatility regimes.
Technical Analysis: BTC
: 65,209.99 : EMA12 > EMA26; SMA50 > SMA200; RSI 57 : Up (47% probability) : - Support near 63,900 (major 62,525)
- Resistance near 66,525 (major 64,725)
- Up breakout: 1h close > 66,525 → 67,844.47 to 69,174.76
- Down breakout: 1h close < 63,900 → 62,627.67 to 61,349.56
Drivers
(contribution): GOLD/SILVER RATIO (1.12), FNG Z-SCORE (-0.8), SP500 RET 1D (-0.65), LS GLOBAL Z-SCORE (-0.55), RV 7D (0.54), STABLE MCAP LOG1P (0.47). : Broad risk assets show soft momentum; BTC dominance rising modestly over 7 days (+0.73).
ETF Flows (BTC/ETH)
ETF flow data is provided for BTC and ETH only and should be interpreted as contextual signals rather than primary inputs for BTC trading decisions. BTC ETFs show a net positive flow of +$132.3M in the last 24 hours, with negative momentum over 5 and 10 days (-$393.5M and -$1.39B respectively). ETH exhibits +$36.7M (1D) with longer-dated flows less supportive. This flow context suggests a cautious appetite for BTC within an overall risk-on/off environment but should not be used as the sole driver for BTC positioning.
: 1D +$132.3M; 5D -$393.5M; 10D -$1.39B : 1D +$36.7M; 5D +$11.6M; 10D -$123.1M
What to Watch Next
- Monitor 1h closes around 66,525 to confirm the upside breakout trigger.
- Watch for a break below 63,900 to assess downside validation and possible re-entry levels.
- Consider macro risk assets’ direction, given cross-asset softness as a supporting/limiting context.
- Track ETF flow shifts in BTC and ETH as supplementary context, not a primary signal for BTC trading decisions.
Hashtags: #Bitcoin #BTCAnalysis #MarketSnapshot #TechnicalAnalysis #ETFFlows #CryptoMarkets #TradingStrategy #Volatility #Momentum #RiskAssets #MarketContext #MacroLinks