
Market Snapshot
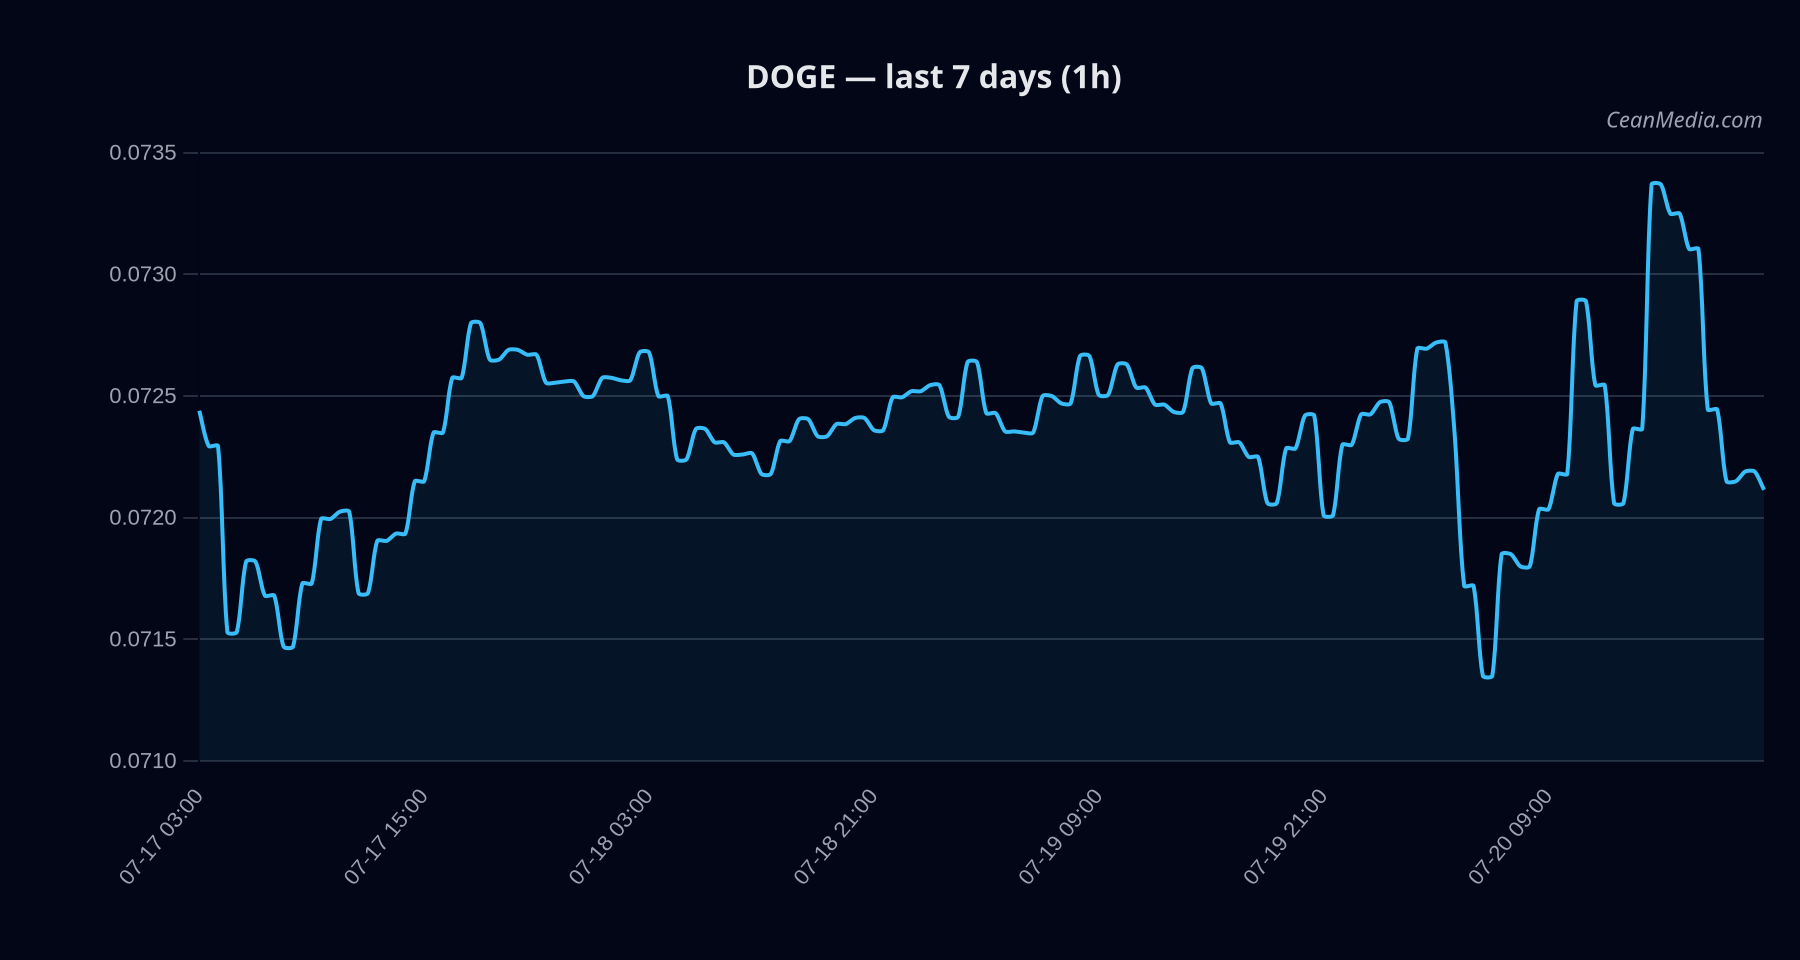
As of 2026-07-20, DOGE sits in a tight intraday range near the 0.072 level, with a bias toward the downside under the current model framework. The composite score is negative, and the forecast range implies limited room for upside without a breakout beyond key resistance. Overall market breadth remains robust, and BTC dominance is elevated in the short term, providing a backdrop for an environment where risk assets can exhibit mixed behavior.
Technical Analysis: DOGE
-2.5 0.072 sideways; RSI 44 EMA12 > EMA26, SMA50 < SMA200, σ24h 0.55%, Vol regime: Very low 0.0720; 20th-80th percentile: 0.0688 – 0.0736
Drivers
- Top model drivers point to a mix of spread dynamics and cross-asset risk signals. Notable contributions include Spread BP (-2.85) and FNG Z-SCORE (positive), with BTC-related momentum supporting the broader risk backdrop at times.
- TA signals show sideways momentum with subdued volatility. RSI remains neutral near mid-range, indicating a balance between buyers and sellers in the near term.
- Macro/market context highlights risk assets softening in cross-market measures, with fear sentiment moderate (F&G 29). BTC dominance trend is positive over 7 days, suggesting BTC-led risk-on/off dynamics can influence altcoins at times.
ETF Flows (BTC/ETH)
Context: ETF flow data is provided for BTC and ETH only and should be considered as macro-market context rather than a primary signal for DOGE. The BTC ETF shows +$132.3M in the last day, with negative 5-day and 10-day flows, while ETH ETF shows +$36.7M for the day with positive 5-day flow but negative 10-day flow. These patterns indicate selective risk-on sentiment in BTC/ETH, which can influence market correlations but does not directly determine DOGE price action.
1D +$132.3M | 5D -$393.5M | 10D -$1.39B 1D +$36.7M | 5D +$11.6M | 10D -$123.1M
What to Watch Next
- Monitor for a close above 0.073 to validate a potential near-term upside with targets toward 0.0749–0.0763 if BO (breakout) conditions hold.
- Watch for a break below 0.071 to validate weakness and potential move toward 0.0691–0.0677.
- Keep an eye on BTC dominance and cross-asset risk signals as they may influence alt-asset correlations in the next sessions.
- Maintain awareness of overall market breadth and volatility regime; very low vol suggests a fragile setup where idiosyncratic DOGE moves could trickle in with small catalysts.
Hashtags: #DOGE #CryptoMarket #TechnicalAnalysis #ETFFlows #BTC #ETH #MarketSnapshot #TradingStrategy #PriceAction #RiskManagement #Altcoins #CryptoNews