
Market Snapshot
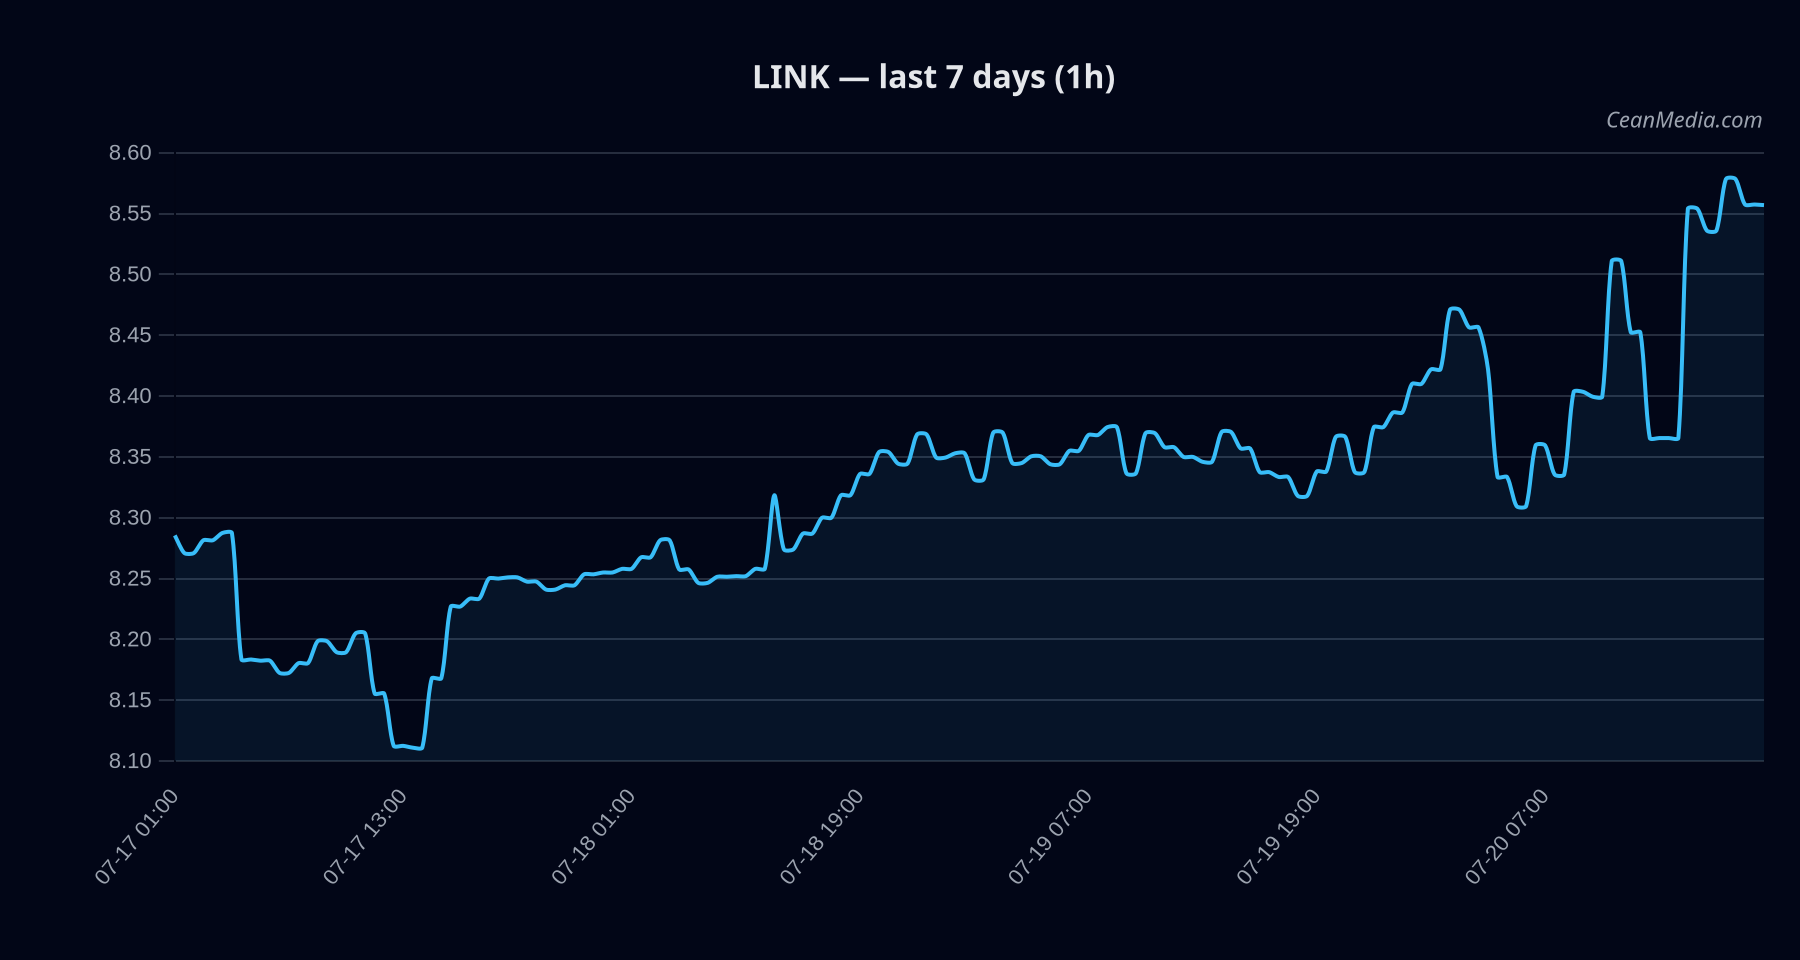
As of 2026-07-20, LINK sits within a tight price range with near-term bullish bias but mixed conviction. The model assigns a +1.9 composite score with low certainty. Broad market context shows very low realized volatility and broad risk-on/off signals from macro indicators, while BTC dominance remains elevated. ETF flow data are provided for BTC and ETH as context and should not be treated as a primary signal for LINK.
Technical Analysis: LINK
1h close > 8.72 targets 8.8881–9.0624. 1h close < 8.38 targets 8.2047–8.0373.
Drivers
1) Return 24h, 2) EMA slope, 3) Funding Z-score, 4) Basis Z-score, 5) Order-book imbalance (EMA5), 6) BTC return 24h. Trend strength around 0.75 with very low volatility regime; vol-of-vol is minimal, suggesting subdued intra-day swings. Cross-market risk assets softened; fear index around 29; BTC dominance trending higher, reinforcing a BTC-led risk context.
ETF Flows (BTC/ETH)
Contextual data show BTC ETFs up by +$132.3M on the 1D window, with 5D and 10D flows negative (-$393.5M and -$1.39B respectively). ETH ETFs show modest 1D inflows (+$36.7M) but larger 5D and 10D net outflows. These figures are BTC/ETH-oriented and should not be treated as a direct signal for LINK; they provide macro liquidity and risk appetite context that can influence correlated assets indirectly.
What to Watch Next
- Monitor 1h close relative to 8.72 resistance for a potential upside extension toward 8.8881–9.0624.
- Watch for a break below 8.38 to assess downside validation toward 8.2047–8.0373.
- Observe changes in market breadth and BTC-dominance as the risk-on/off backdrop evolves, given the current correlation signals.
- Track volatility regime shifts (σ24h and vol-of-vol) which could pre-empt larger moves if liquidity conditions change.
Hashtags: #LINK #CryptoAnalysis #MarketOverview #TechnicalAnalysis #ETFFlows #BTC #ETH #Liquidity #RiskOn #RiskOff